
XRP Technical Analysis – October 2021
Monthly Analysis
In the last 30 days, XRP initially increased by 28%. This uptrend was then stopped by resistance at $1.22. After that, the price of XRP has been on a constant decline as the price has dropped by 14% in the last few weeks. Based on this, XRP is in a downtrend in the short run.
Weekly Analysis
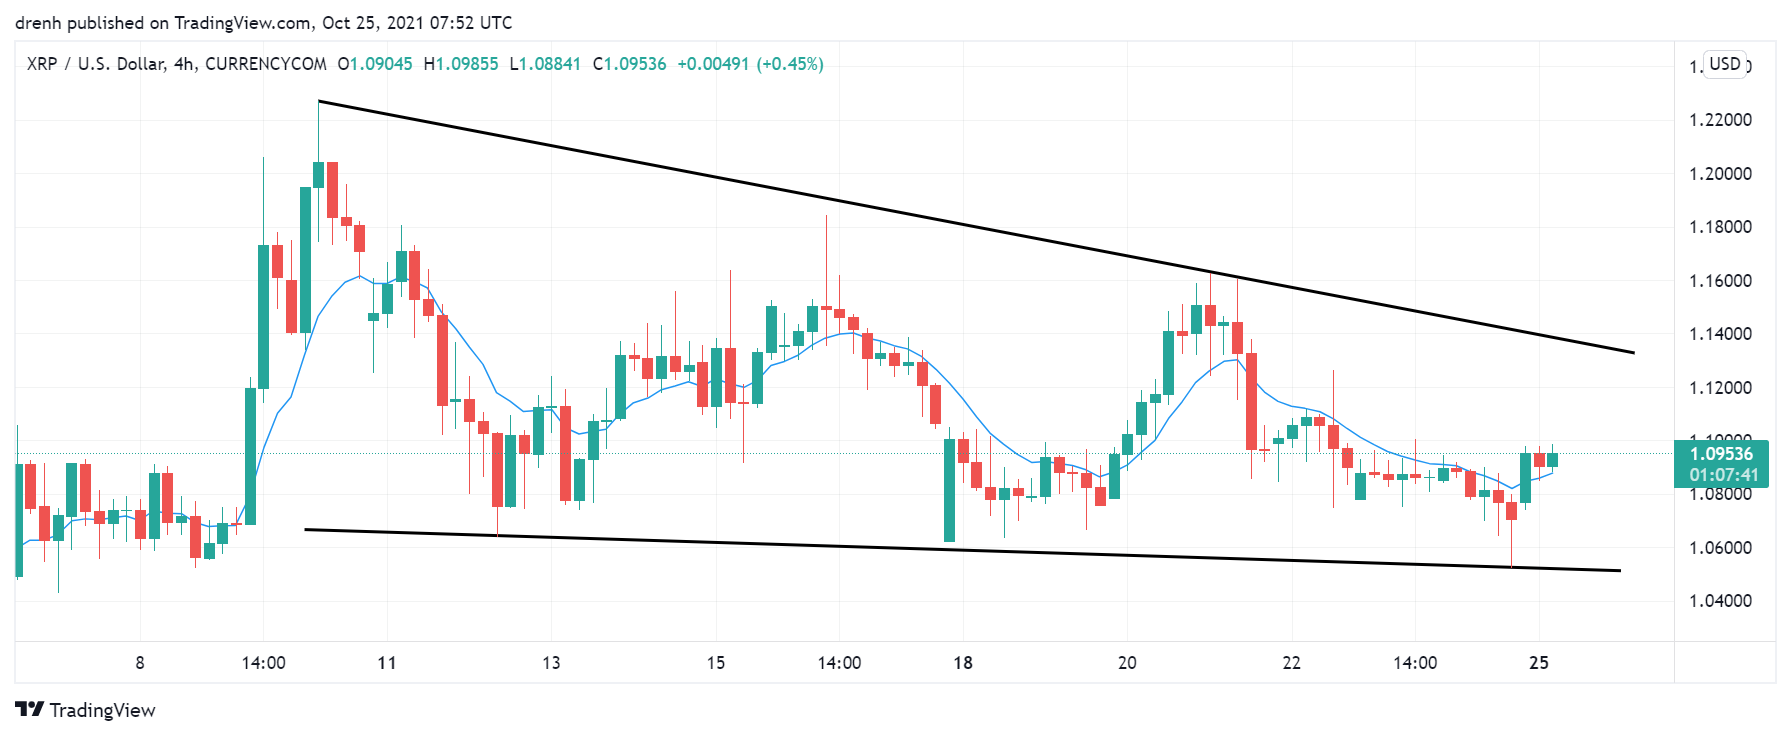
In the last 7 days, XRP increased by 9%, only to then drop by another 9%. The new highs and lows are lower than the previous ones, indicating a downtrend in a 4-hour chart for XRP. The price could keep declining.
Daily Analysis
After increasing by 2% in the intraday chart, the price of XRP is now in consolidation. In the 30-minute chart, a bullish gap can be noticed recently, indicating that traders are bullish in the shorter run.
Key Structures
Support
- $1.05
Resistance
- $1.16
Indicators
Moving Average
The 20-day moving average has now moved above the price due to the recent trend. This indicates that the price of XRP could keep declining in the coming days.
The 9-day EMA is also slightly above the price and currently acting as resistance to the price of XRP. This is also an indication that the price could decline in the short run.
Relative Strength Index
The RSI in the 1-day chart is fairly average and at around 50, meaning that there is plenty of room for XRP to either increase or decrease. The same applies to the 4-hour chart.
MACD
In the 1-day chart, the MACD line has recently moved below the signal line, indicating that the momentum is now bearish and that the price could keep declining. As for the 4-hour chart, the MACD line has recently moved above the signal line, meaning that the momentum is bullish in the shorter run.
Fear & Greed
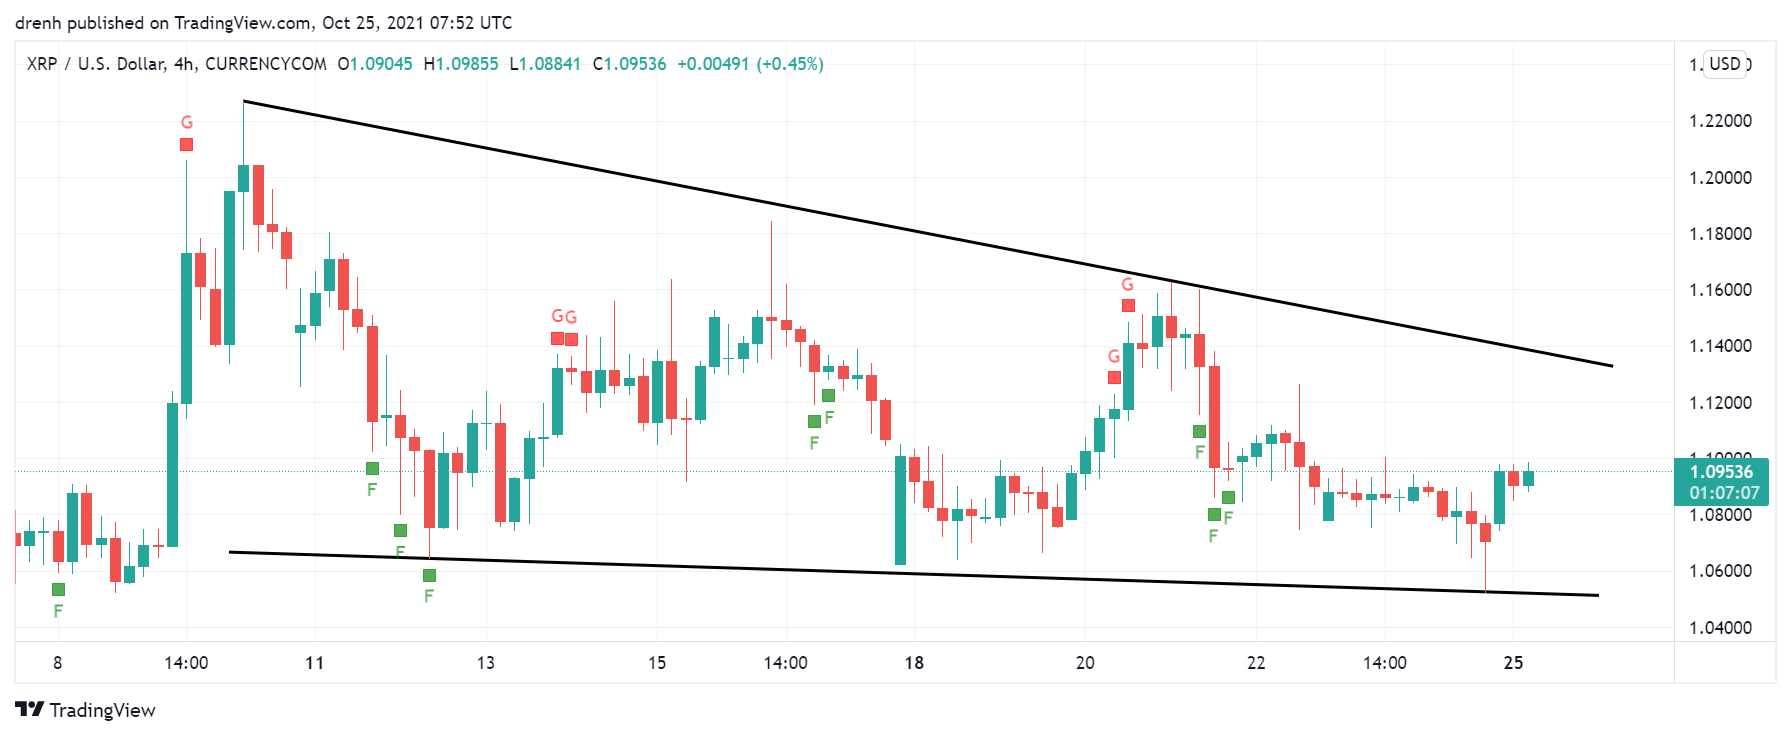
The fear and greed indicator of a 4-hour chart suggests that the current emotion of XRP traders is fear due to the recent downtrend.
Fibonacci
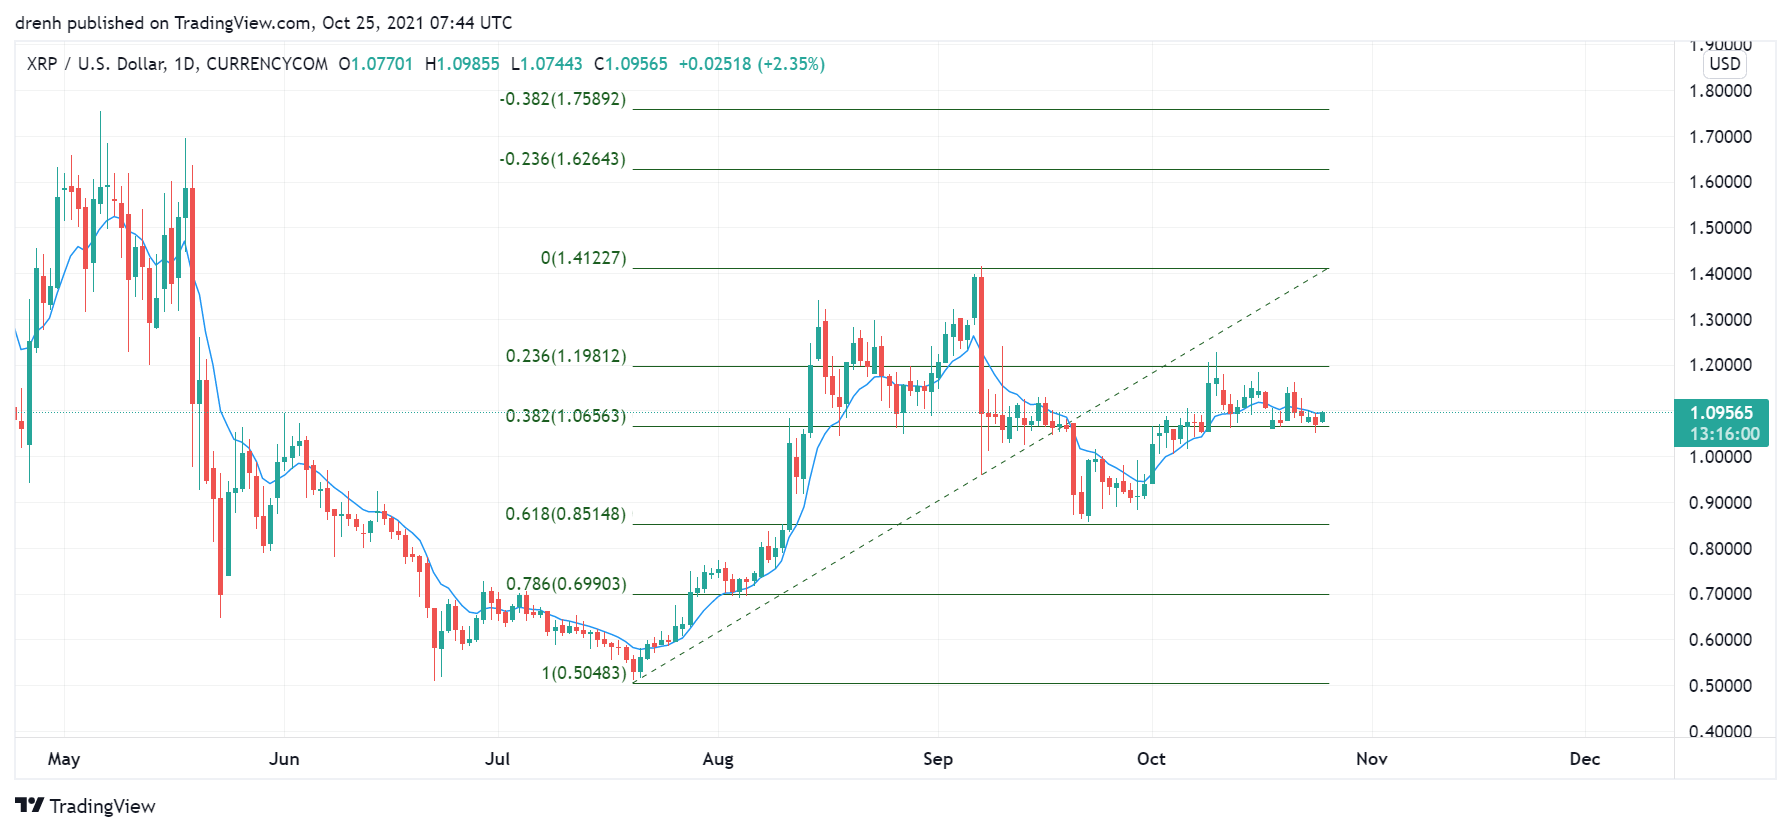
The Fibonacci retracement levels in a 1-day chart suggest that the price of XRP had retraced to the 61.8% level. This indicates that the price could increase up to the 23.6% extension level.
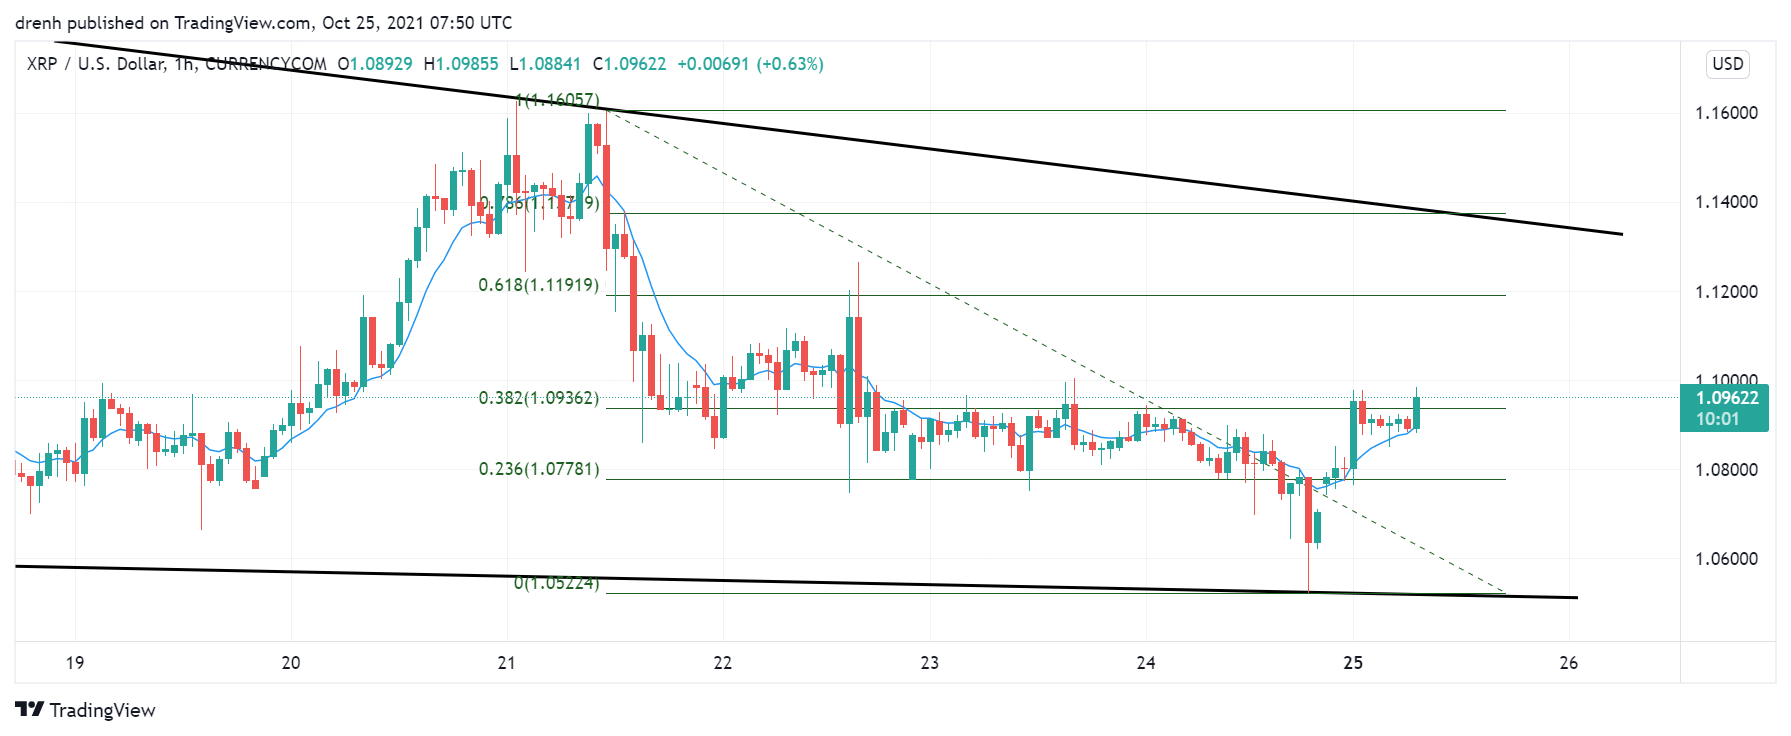
In a 1-hour chart, Fibonacci levels of the recent downtrend suggest that the price could retrace and face resistance on one of the levels in the coming hours.
Price Prediction XRP – October 2021
Based on this technical analysis on XRP, its price could further decline in the coming days. However, if the buying pressure is high on the projected resistance levels, the trend could reverse in a 4-hour chart. Furthermore, since the price has found support at 61.8% in a 1-day chart, then the price could increase up to $1.60 in the coming weeks. A price of $2 is only possible if BTC increases at larger rates as some experts anticipate in this bull cycle.
Latest News for XRP – Affecting Price
Recently, the CEO of Ripple has stated that the SEC failed to see Ethereum as security as well since it has allowed the latter to ‘surpass’ XRP as one of the best cryptocurrencies in the market. This implied accusation on Ethereum could lose XRP holders (HODLers) that also support Ethereum.
Also read: Ripple Price Prediction 2021 – Will the XRP Price Explode After the Issue with SEC is Resolved?
 Surges Post-Bitcoin Halving")

