
Like the stochastic oscillator, the relative strength index is a momentum indicator used by traders to measure the extent of recent price movements to identify an overbought or oversold cryptocurrency or another asset. The relative strength index was firstly introduced by J. Welles Wilder Jr. in his book “New Concepts in Technical Trading Systems” in 1978.
Why is the Relative Strength Index Important?
The indicator is displayed as a line in a graph that continuously moves between two limits – 0 and 100. According to the traditional interpretation of the RSI, values equal to or above 70 show that a cryptocurrency is becoming overbought/overvalued and may experience a corrective pullback in price. On the other hand, a relative strength index equal to or below 30 implies that a cryptocurrency is oversold/undervalued.
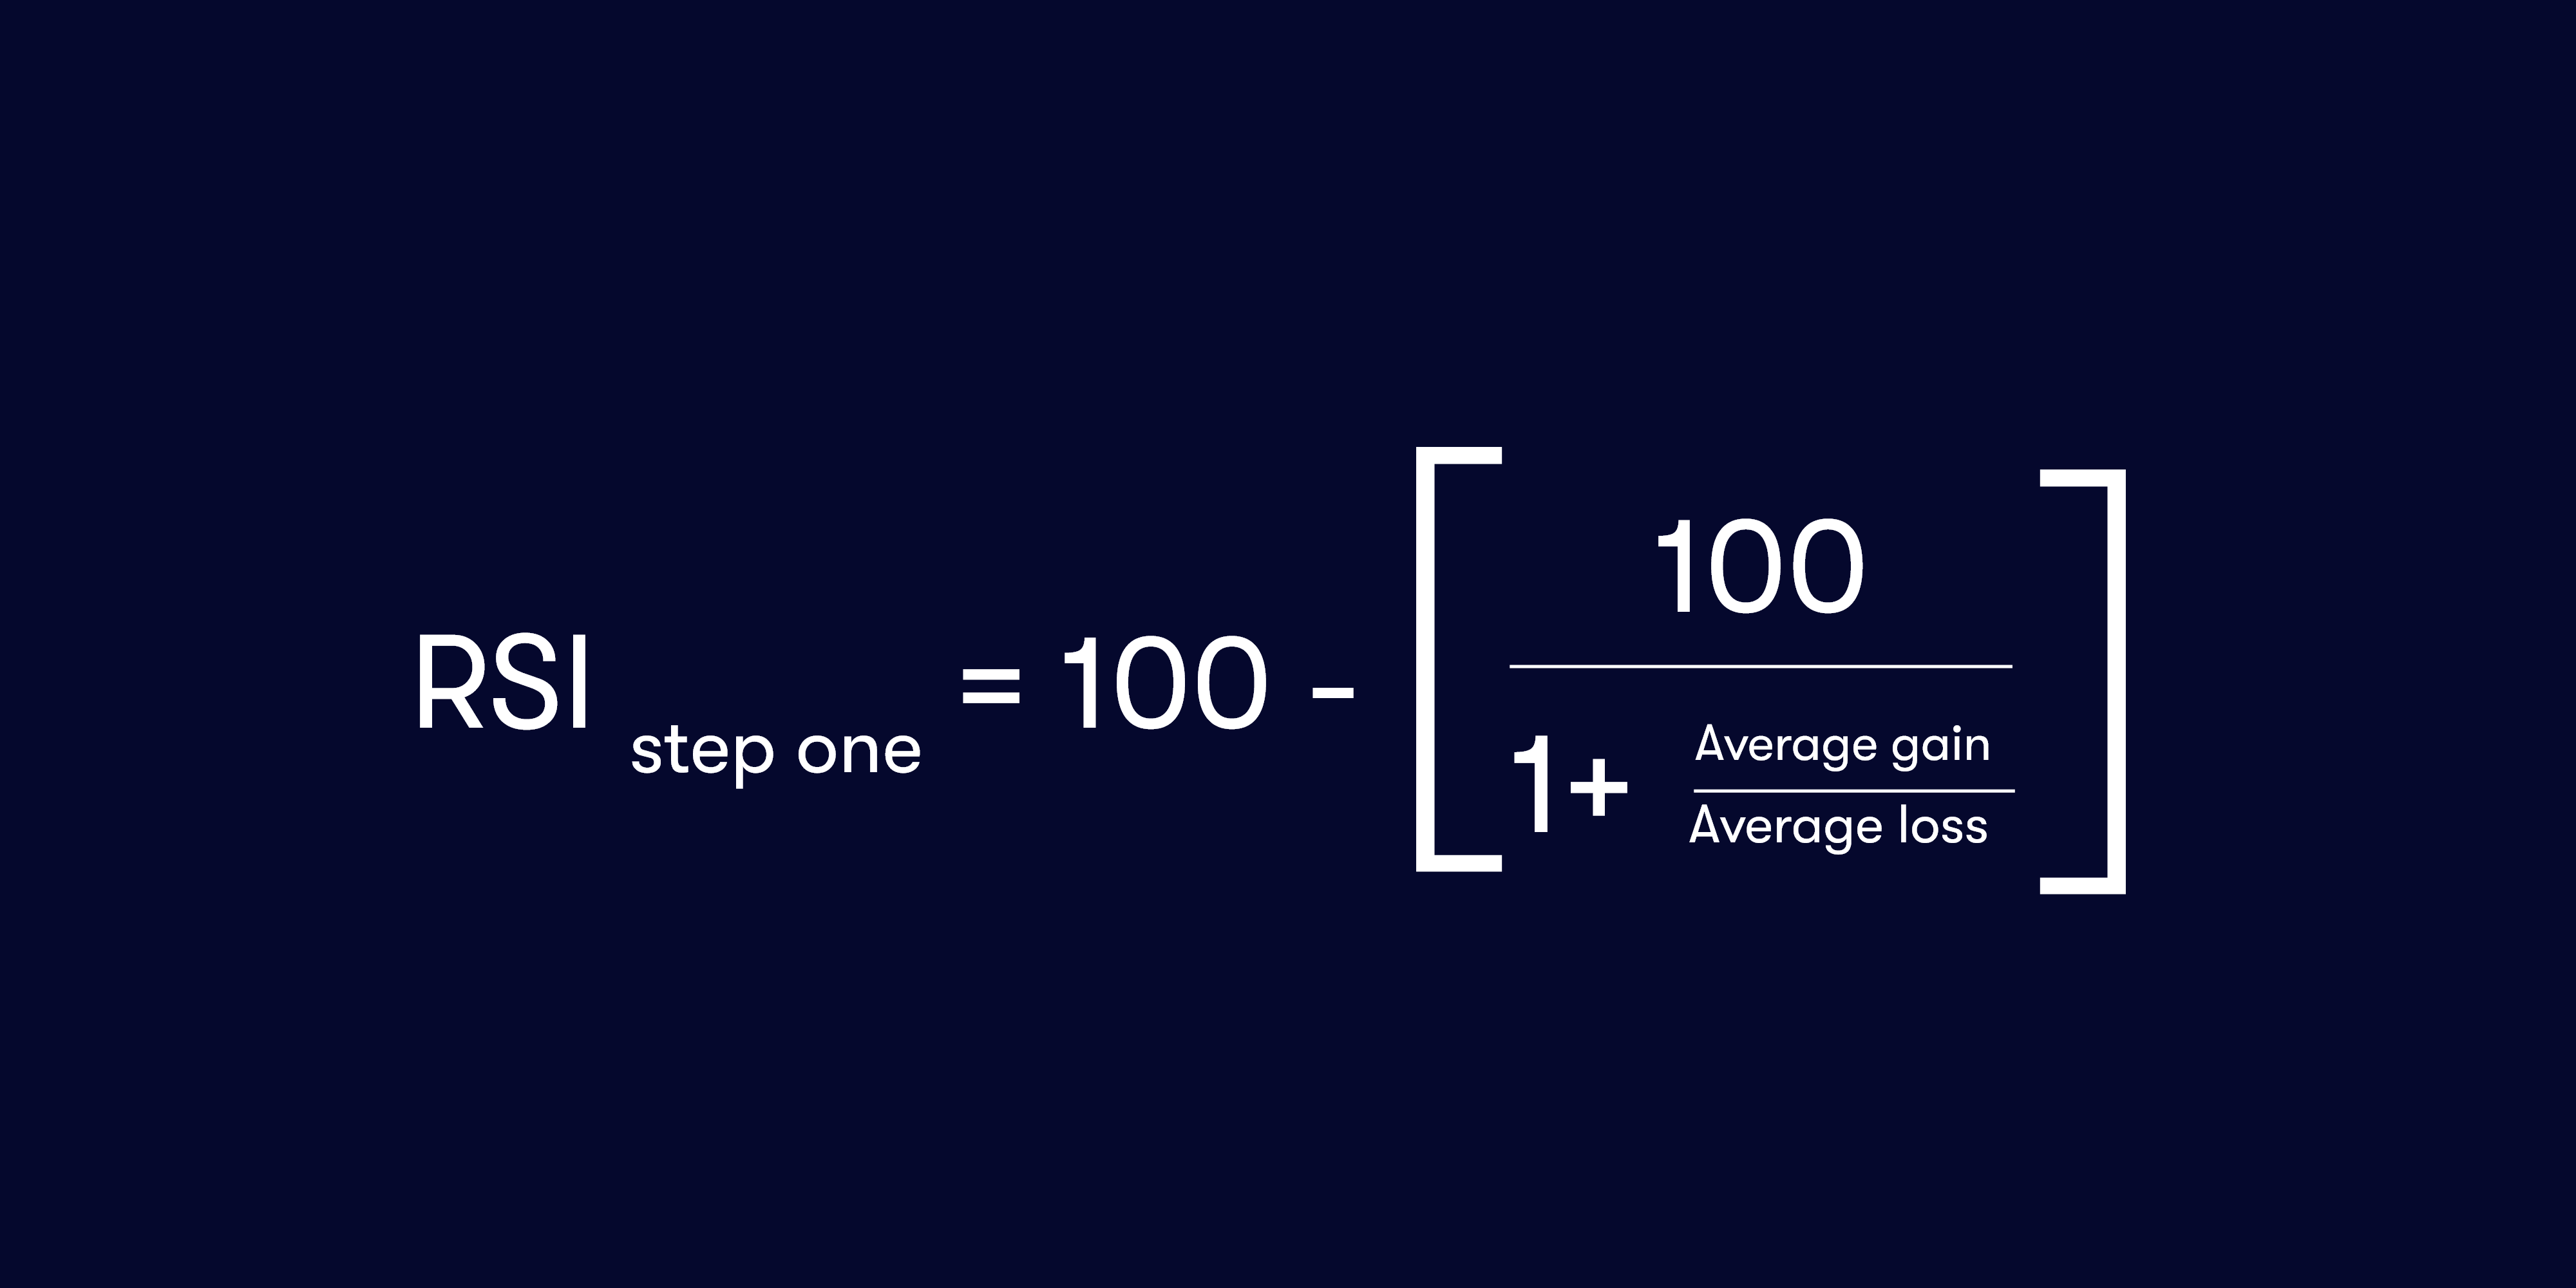
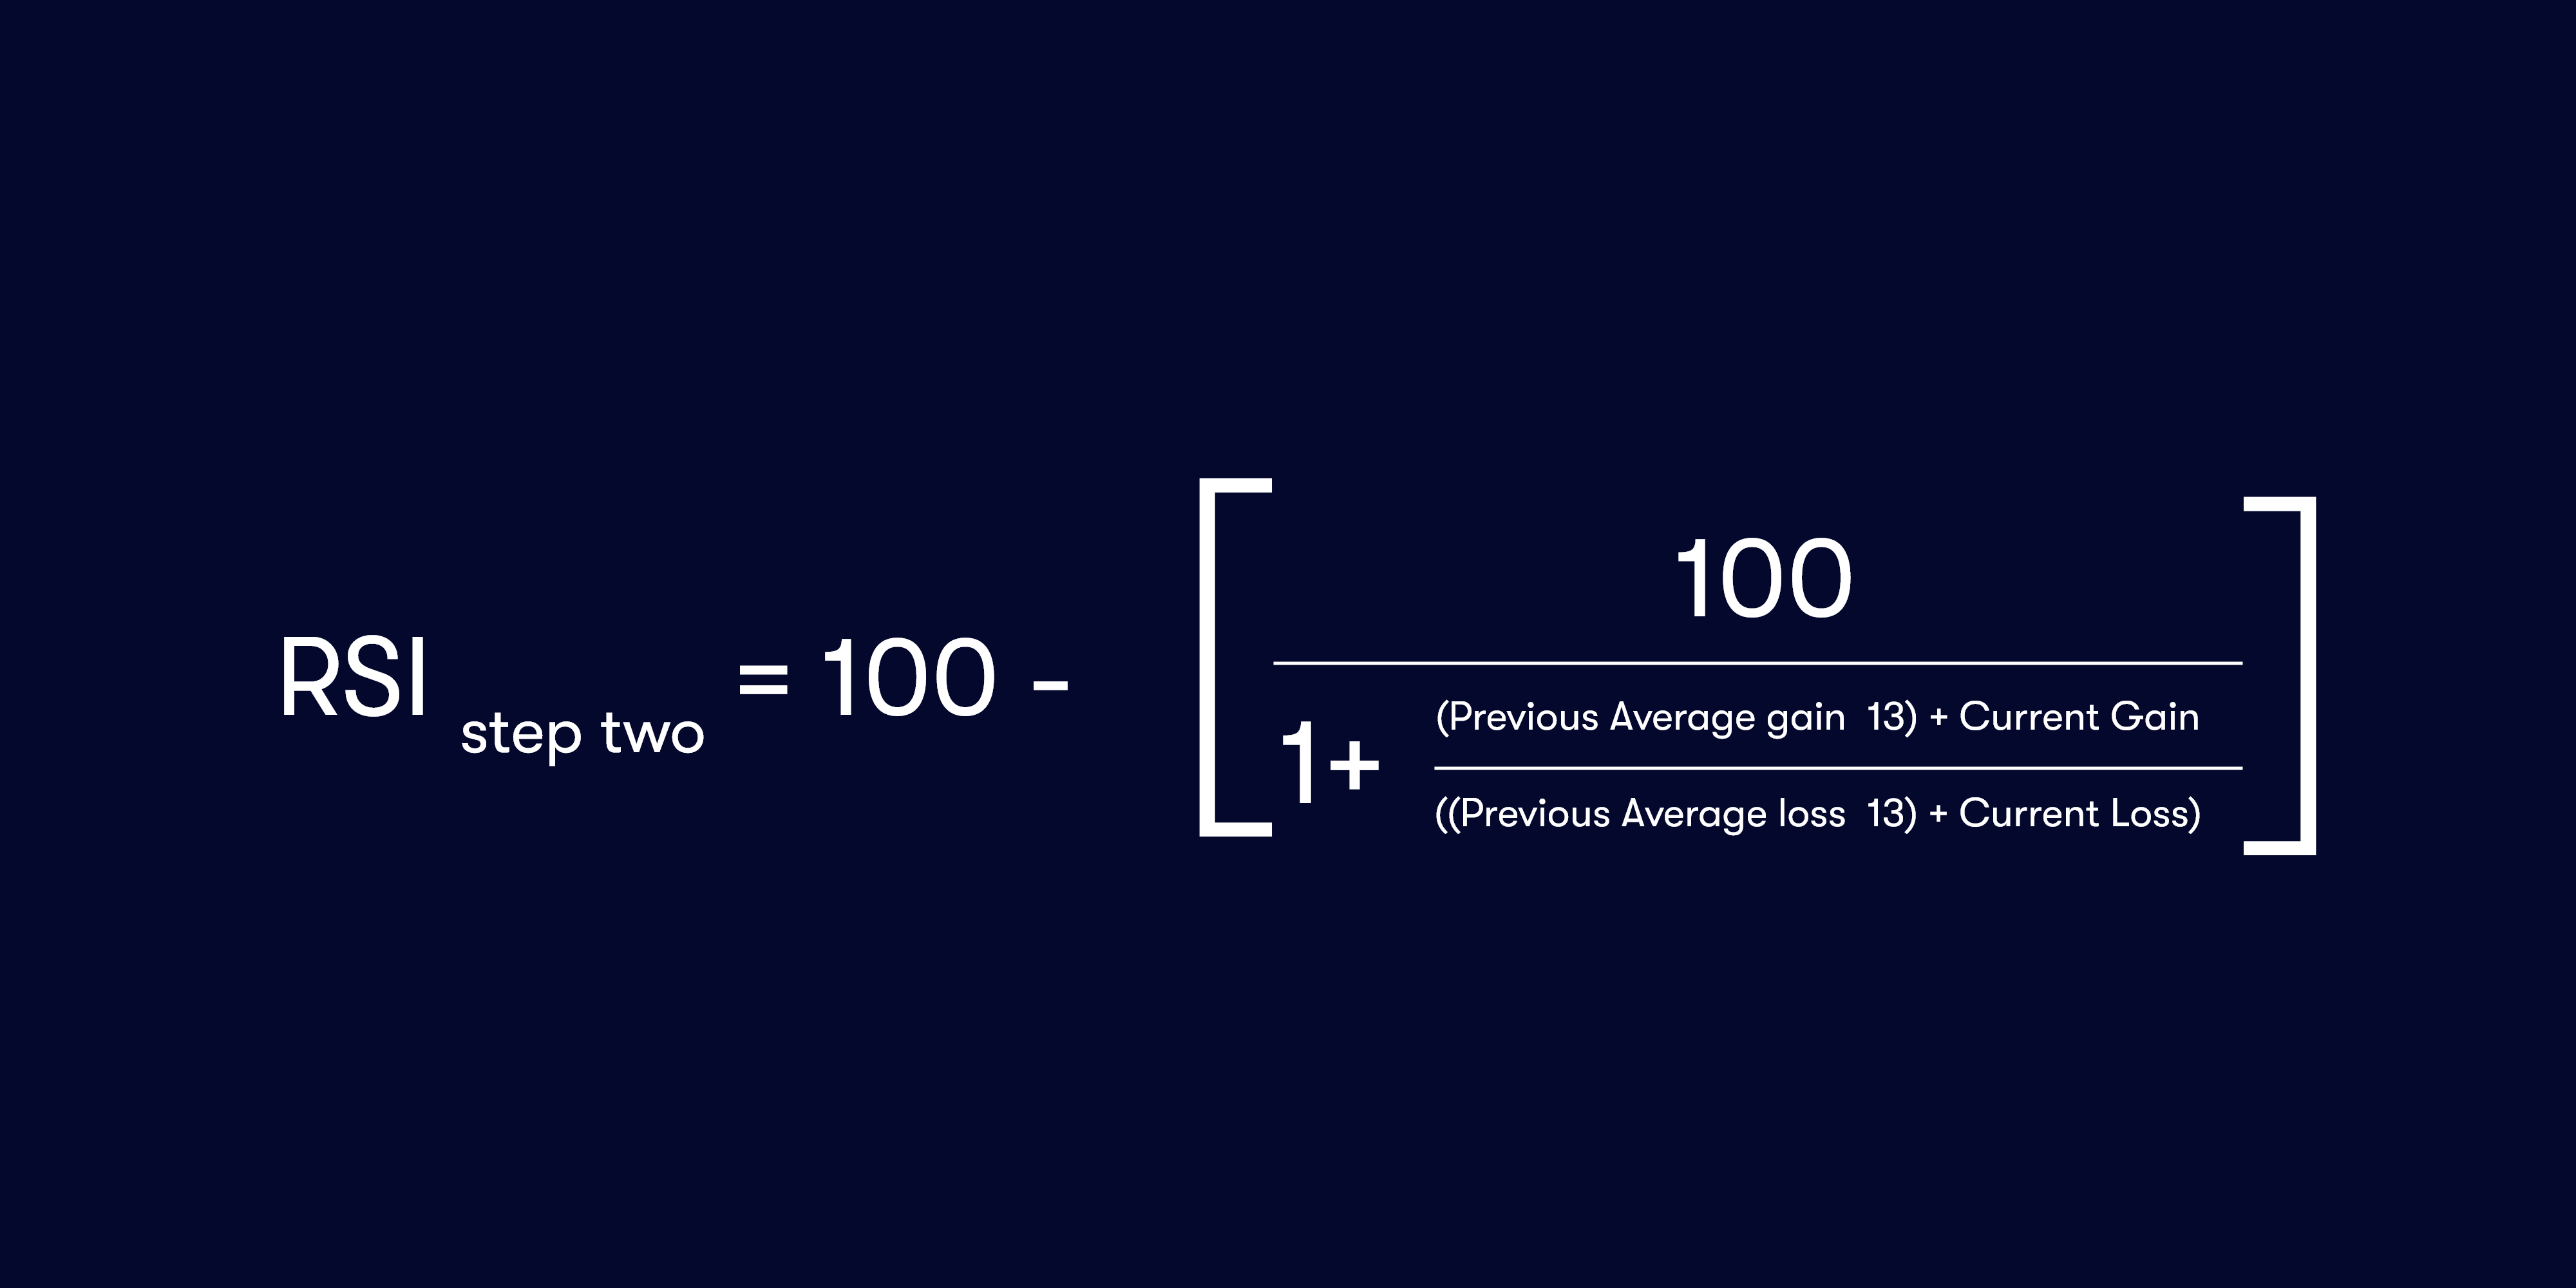
The average percentage loss or gain during a look-back period is the average gain or loss in this calculation. After 14 periods of data become available, you can calculate the second part of the RSI formula.
Being an important tool as a trading indicator, understanding what the RSI tells you is a must. According to Constance Brown, an uptrend is indicated when an oversold cryptocurrency’s RSI is way higher than 30% and that a downtrend is indicated when an overbought cryptocurrency’s RSI is way lower than 70%.
Also Read: What Are Fibonacci Retracements & Fibonacci Ratios?
Takeaways
- The relative strength index (RSI) is a momentum indicator that indicates whether a cryptocurrency is being oversold or overbought.
- It can have readings from 0 to 100. The higher the RSI the more a cryptocurrency is becoming overbought, and vice versa.
- This indicator was first introduced by J. Weller Wilder Jr. in 1978.
: Revolutionizing Blockchain Technology or Just Another Crypto Player?")
 - Everything You Need To Know")
