
TRX Technical Analysis – October 2021
Monthly Analysis
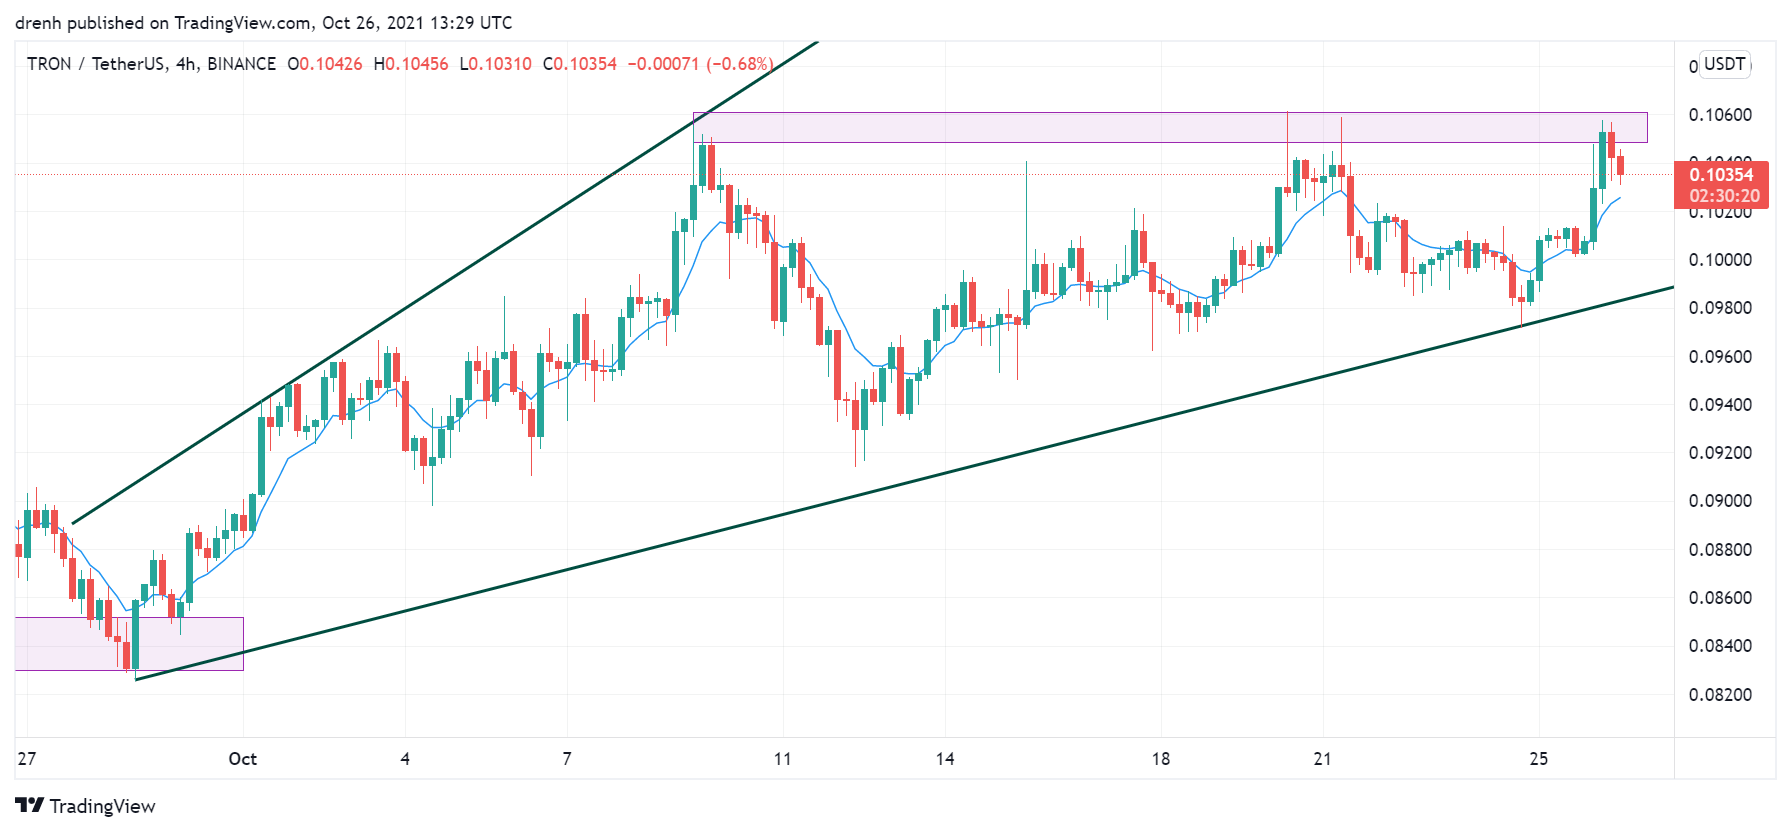
Over the last 30 days, TRX has been on the rise. It has increased by around 28%, but it failed to break resistance at $0.10 on three occasions. While this suggests that the selling pressure is high, TRX is still bullish and could increase in the coming days once the pullback occurs.
Weekly Analysis
In the last 7 days, TRX initially declined by 8%. However, TRX found support at around $0.097, and it has started increasing again. After hitting $0.10, it has started to decline once again.
Daily Analysis
In the intraday chart, TRX has increased by 5%, which might have been quite profitable in a span of a few hours. Nonetheless, the price is now retracing.
Key Structures
Support
- $0.097
Resistance
- $0.106
Indicators
Moving Average
The 20-day moving average is below the price, which indicates that the trend is still upwards and that the price of TRX can keep increasing in the coming days.
The 9-day EMA is currently acting as support to the price of TRX, as it is slightly below the price and preventing potential price decreases.
Relative Strength Index
The RSI of a daily chart has been increasing recently, indicating that the momentum is bullish and that there is still more room for the price of TRX to grow. In a 4-hour chart, the RSI was recently in the overbought region, which hinted at a possible pullback. Because of that, it has declined in the last few hours.
MACD
The MACD line in a 1-day chart is slightly above the signal line, meaning that the momentum is bullish and that the price could keep increasing in the coming days. It is even more bullish in the 4-hour chart.
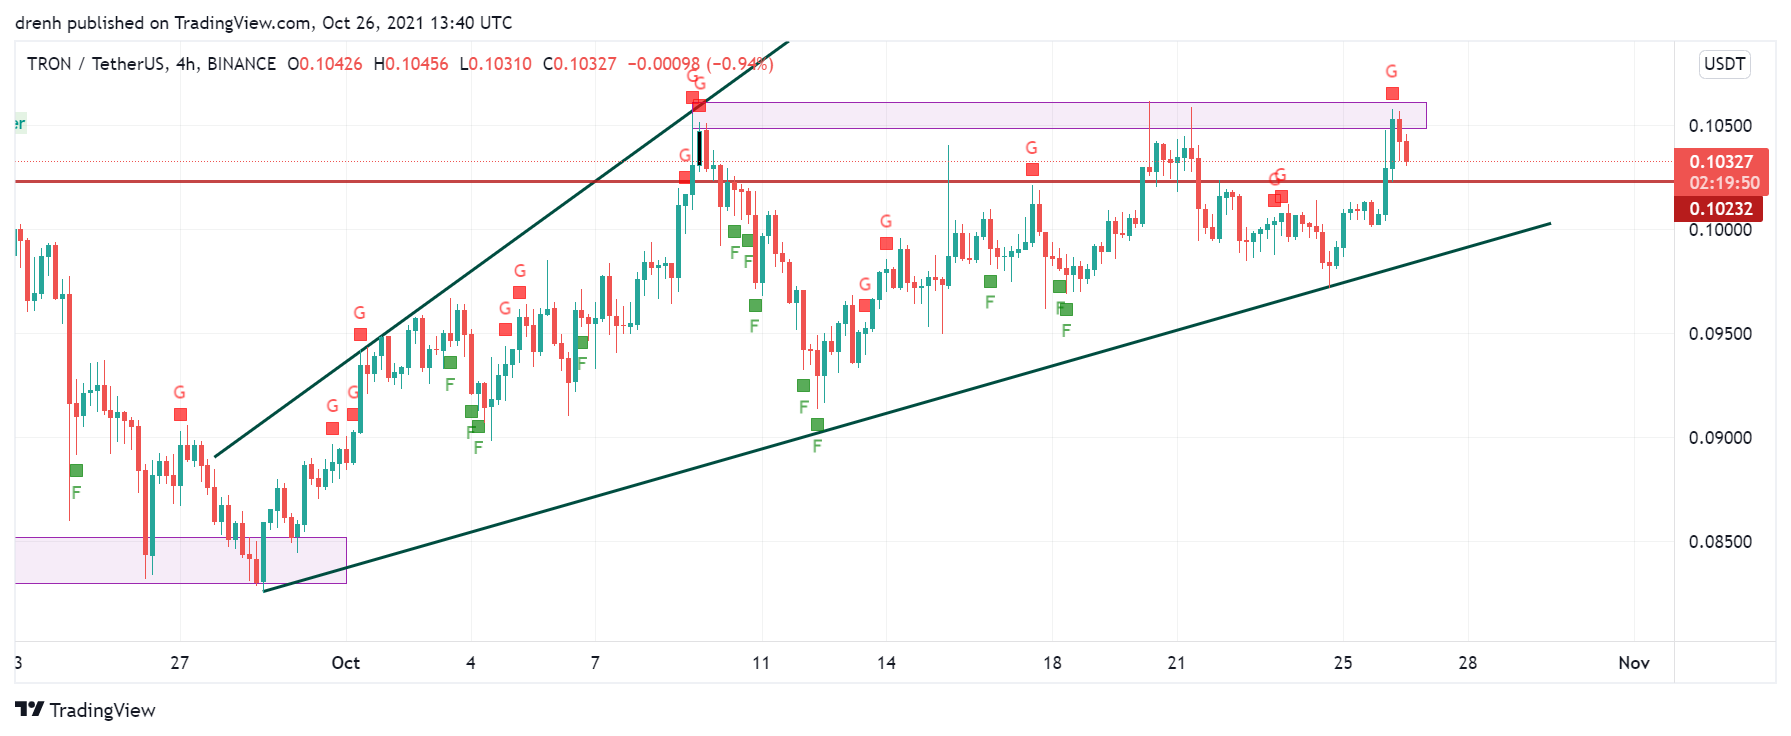
Fear & Greed
The fear and greed indicator of a 4-hour chart suggests that the current emotion of TRX traders is greed, meaning that traders are bullish.
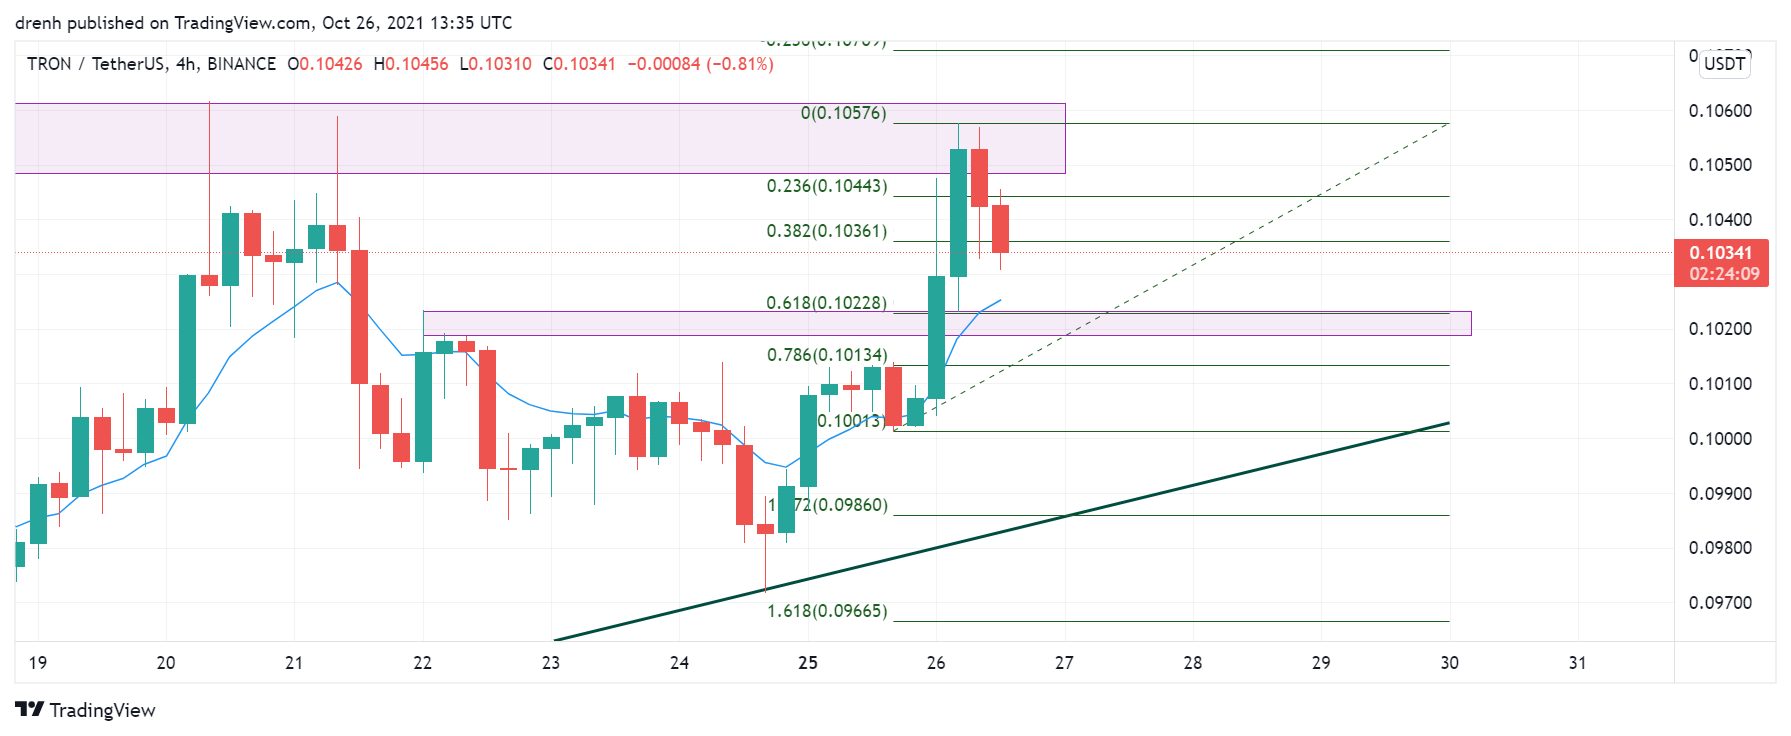
Fibonacci
The Fibonacci retracement levels in a 4-hour chart suggest that the price could retrace to the 61.8% Fibonacci level in the coming hours. If it finds support there, then TRX could increase again after that.
Price Prediction TRX – October 2021
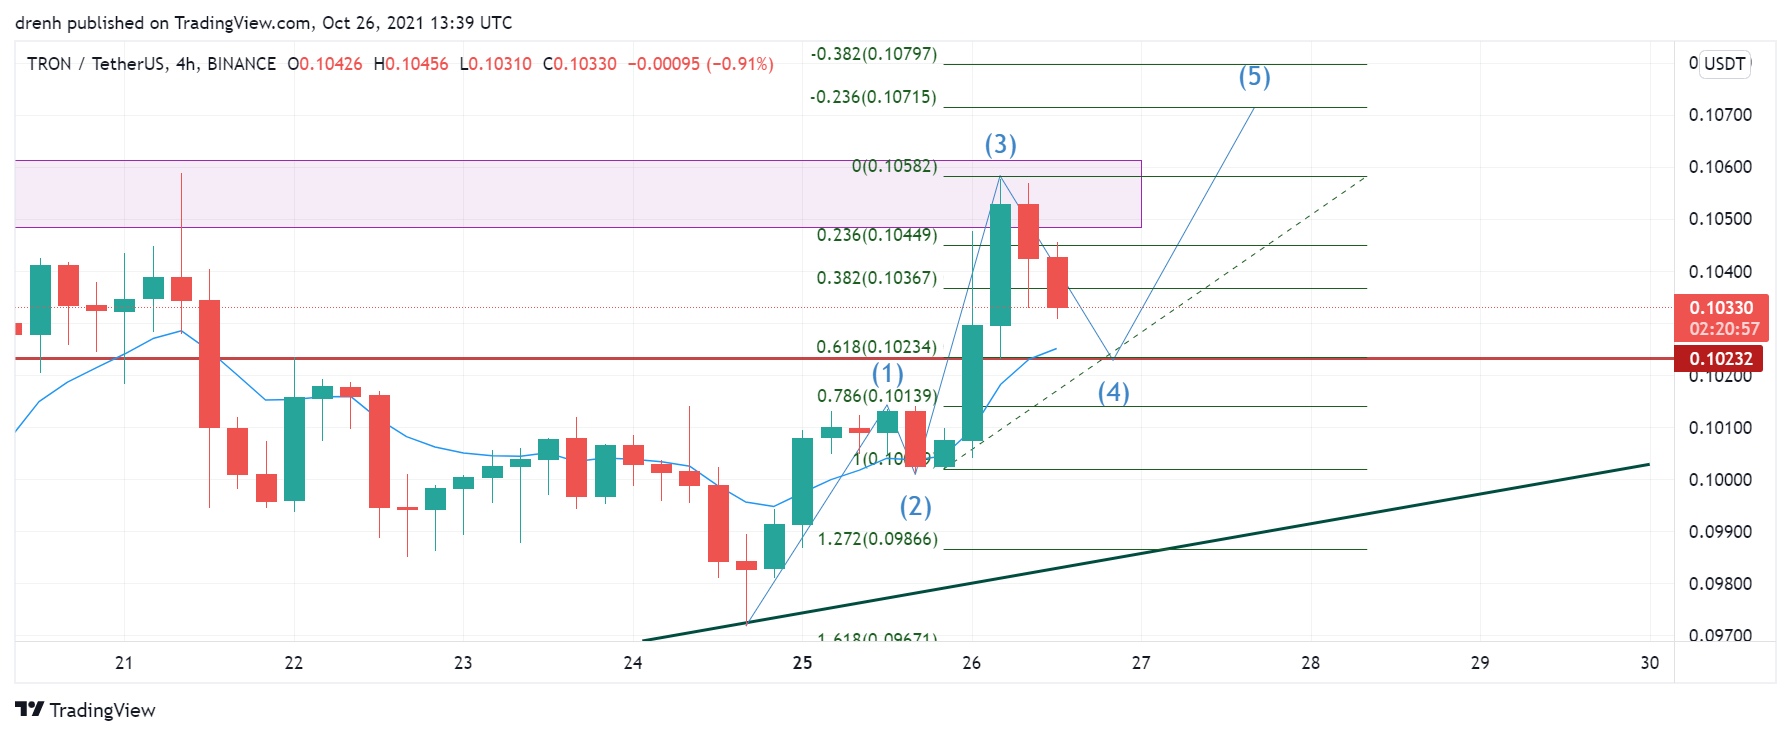
Based on this technical analysis on TRON (TRX), we could see its price decline in the coming hours. If TRX finds support at $0.102, where both a previous resistance structure and the 61.8% level align, then we could see TRX increase up to $0.11 in the following hours. The Elliott Waves pattern would also take shape if the price moves as it is predicted.
As for the longer-term prediction, TRX is bullish. If its price keeps increasing at this rate, and if BTC manages to reach a new all-time high, TRON could potentially attempt to reach its previous all-time high. A price of $0.50 is possible in the longer term.
Latest News for TRX – Affecting Price
Tesla could accept payments through cryptocurrencies once again. If this happens, then the whole market can be positively affected, especially if it is announced by a whale investor such as Elon Musk. This can have a good effect on the price of TRON.
Also read: TRON Price Prediction 2021 and for the Next 5 Years – Will TRX Reach $1?
 Surges Post-Bitcoin Halving")

