
RUNE Technical Analysis – September 2021
Monthly Analysis
In the last 30 days, RUNE initially increased by 30%. However, the price was then followed by a decrease of 42%. The price attempted to correct in the following days, increasing by more than 50%. Just as everyone thought that RUNE was going to continue this rebound, the price had another decrease of 42%.
Weekly Analysis
In just the last 7 days, the price of RUNE has decreased by 40%. The price found support at $6.5. Then, RUNE started increasing again, reaching as high as $9.25. The price has started
Daily Analysis
In the intraday chart, RUNE has been highly volatile, and it has decreased by 20%. In the coming hours, RUNE might keep decreasing after failing to break resistance at $7.95.
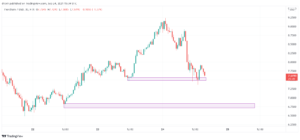
Key Structures
Support
- $7.36
Resistance
- $8.90
Indicators
Moving Average
Due to the recent price decrease, the 20-day moving average is now above the price of RUNE. This might indicate that the trend is now downward and that the MA line could act as resistance in the coming days.
The 9-day EMA is now also above the price due to the recent price dip. This EMA line can resist potential rebound attempts.
Relative Strength Index
The RSI of a daily chart is below 50, indicating that the momentum is bearish, but it also suggests that there is room for both an increase or a decrease in the price of RUNE. The same applies to a 4-hour chart.
MACD
The MACD line is well below the signal line and also below the baseline. This indicates that the momentum is bearish and that the price of RUNE can keep decreasing in the coming days. In a 4-hour chart, the MACD line is above the signal line, indicating that the price could still keep increasing in the coming hours.
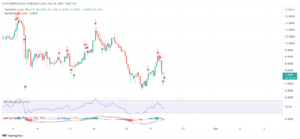
Fear & Greed
The fear and greed indicator suggests that the current emotion for RUNE traders is bearish.
Fibonacci
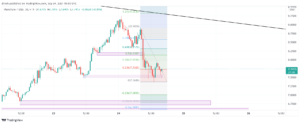
The Fibonacci retracement levels in a 4-hour chart clearly show that the price retraced and found support at 61.8%. Judging by this, the price could aim for the 27% Fibonacci extension level.
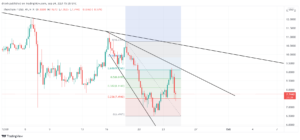
In a 1-hour chart, where RUNE started declining after hitting $9.25, the price has respected Fibonacci retracement levels and found resistance at 61.8% once again. As expected the price went further down in the following hours.
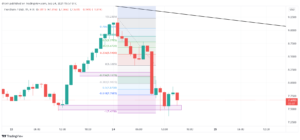
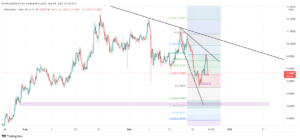
As for the most recent price decline in a 30-minute chart, the price of RUNE respected the 38.2% Fibonacci level as it found support there. We can expect its price to keep decreasing in the coming hours.
Price Prediction RUNE – September 2021
In the coming days, RUNE might keep decreasing if it respects the current trend line and its recent price movement. We might see RUNE go as low as $7, and it may even go below that level.
Latest News for RUNE – Affecting Price
THORChain might try and solve recent fragmentation issues caused between DeFi and other blockchains. However, this has not been as simple as project development has noticeably slowed for THORChain.
Also read: THORChain (RUNE) Price Prediction – What are the Forecasts for the RUNE Price in 2021 and Beyond?
 Surges Post-Bitcoin Halving")

