
FKX Technical Analysis – September 2021
Monthly Analysis
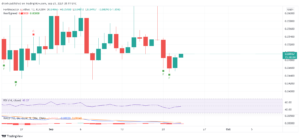
In the last 30 days, FKX increased by 54%, reaching $0.066. Nonetheless, the price started declining after that. It decreased by more than 30% in the following weeks. This might indicate that the trend is now downwards for FKX, but FKX can easily reverse again and surge higher.
Weekly Analysis
In the last few days, FKX decreased by around 28%. This suggests that the short-term trend is downward. FKX might try to retest resistance at $0.051 in the coming hours.
Daily Analysis
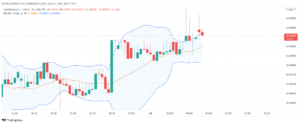
In the intraday chart, FKX has been bullish. The price has increased by 6% in the last few hours. If FKX encounters resistance in the coming hours, then the price might begin decreasing again.
Key Structures
Support
- $0.044
Resistance
- $0.051
Indicators
Moving Average
The 20-day moving average is above the price, indicating that the trend has reversed and that the price might keep decreasing. The MA line can act as resistance in the coming days.
The 9-day EMA is coinciding with the upper wicks of the recent candlesticks, indicating that the price is encountering resistance. This is also an indication that the price can decrease unless FKX has an unanticipated bullish breakout.
Relative Strength Index
The RSI of a daily chart is fairly average at around 50. This suggests that the price is neither bullish nor bearish, where there is plenty of space for either to occur. Similar can be said about a 4-hour chart.
MACD
The MACD is slightly below the signal line in a daily chart. The former is moving below the baseline, indicating that the momentum is bearish. However, the 4-hour chart MACD is above the signal line, meaning that the price can increase in the short run.
Fear & Greed
The fear and greed indicator suggests that the current emotion for FKX traders is fear due to the recent downtrend. This fear can easily lead to an increase in the price if it continues at this rate.
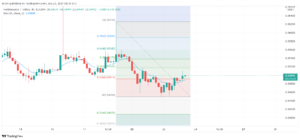
Fibonacci
The Fibonacci of the recent downtrend suggests that FKKX could potentially retrace to one of the retracement levels. If that occurs and FKX faces resistance, the price could decline as low as $0.04.
Price Prediction FKX – September 2021
Based on this technical analysis, we might see FKX go close to $0.04 if it fails to break resistance at $0.51 and manages to break the projected support structure. If resistance is broken, we might see FKX aiming at $0.055 or even reach $0.06. FKX has shown recently that it can have upward breakouts that could be quite profitable for FKX buyers so it might not be surprising if FKX manages to do so again.
Latest News for FKX – Affecting Price
There has not been any major news for FortKnoxster in recent days. Nonetheless, its price could be easily affected by other cryptocurrencies such as Bitcoin (BTC). If BTC has another upward surge, then we could see FKX increase as well. In the long run, FKX is still bullish, and its price can reach $0.20 by the end of the year.
Also read: FortKnoxster Price Prediction 2021 and Beyond – Is FKX a Good Investment?
 Surges Post-Bitcoin Halving")

