
QNT Technical Analysis – April 2022
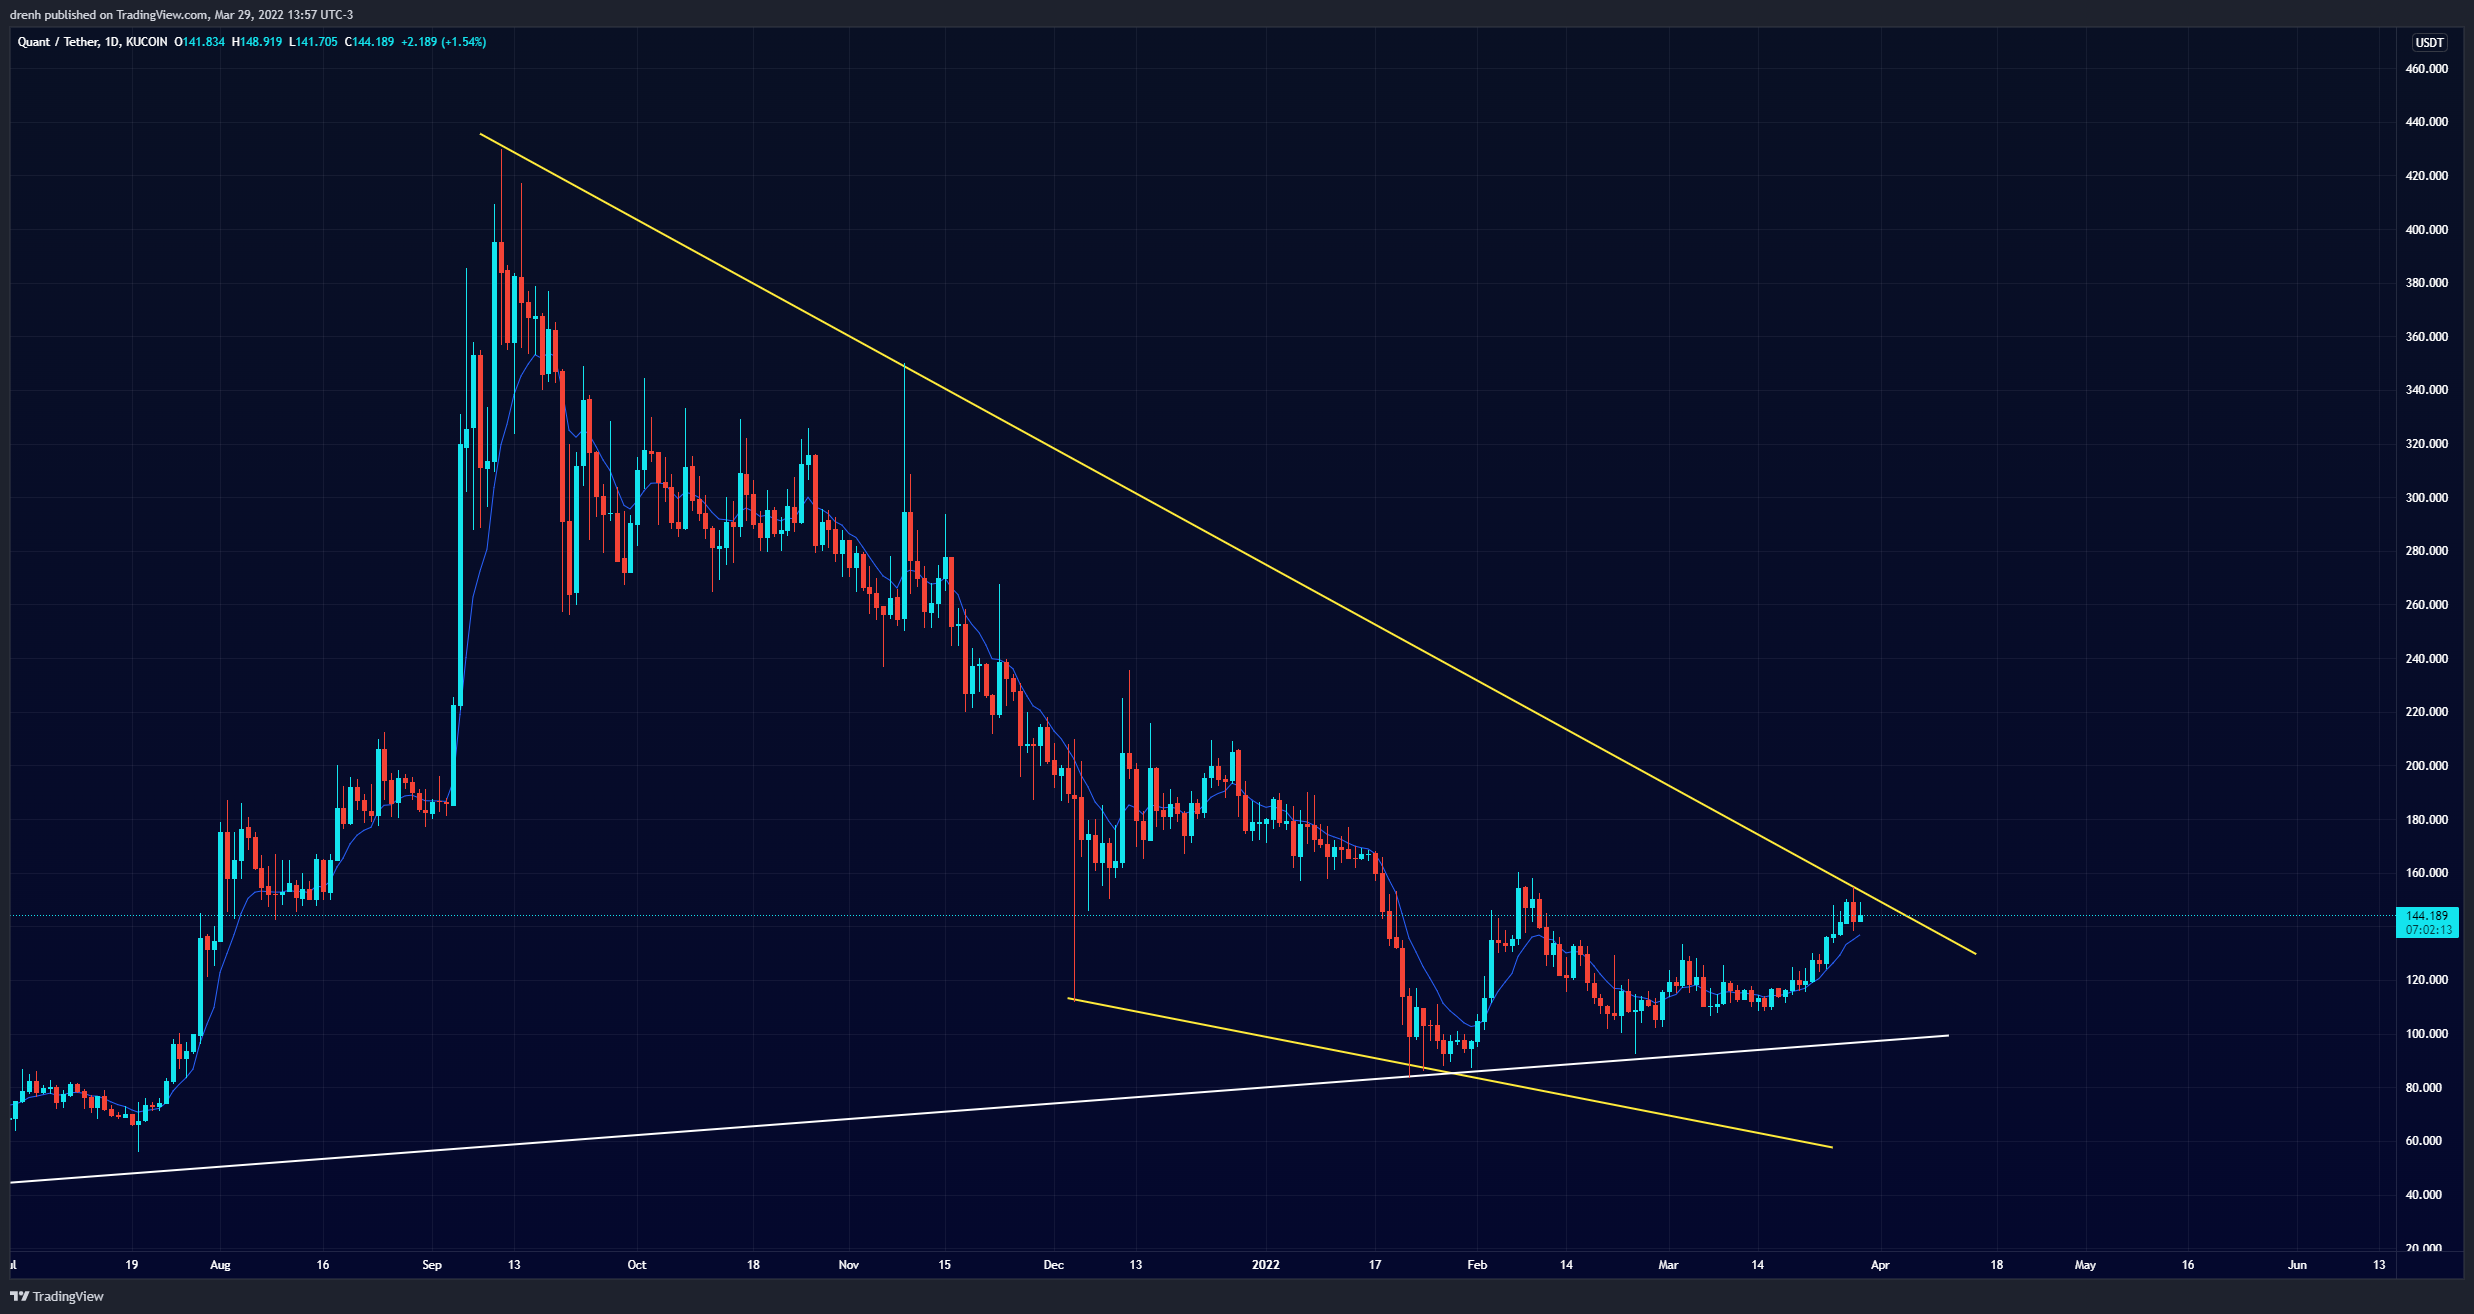
Quant (QNT) hit its all-time high in September of 2021 at a price of close to $430. After that, the price went downhill. QNT ended the year on a bearish note, where it fluctuated slightly below $200. This had marked a decline of around 60% from its all-time high.
Quant maintained this bearish approach in the new year as well. In January alone, QNT dipped by an additional 60%, reaching as low as $85. This marked the lowest point of QNT since late July of 2021. Nonetheless, the price of QNT managed to have a correction after that, where it increased by around 90% and hit resistance at $160. This increase was an indicator that the trend is reversing for QNT. Nonetheless, the price retraced back close to $90, where it also found support.
The last week of February and the whole month of March were generally bullish for QNT in the daily chart. The price has increased by more than 65% in these last few weeks, and the price of QNT is currently facing resistance at $155.
The longer-term trendline is still bullish, which was recently tested and proved to be a strong support zone. Nonetheless, looking only at the past few months, QNT is still bearish, where an increase in the coming days could see the upper trendline be broken and lead to a trend reversal. The recent price movement has also created a descending wedge pattern, meaning that the price may eventually have a breakout as the wedge gets narrower, other things equal.
Key Structures
Support
- $108
Resistance
- $160
Indicators
Moving Average
Both the 20-MA and the 50-MA lines are currently quite below the price of QNT, meaning that the trend is now bullish for Quant and that the price may increase in the coming weeks or even months.
The 9-EMA is also currently below the price of QNT, indicating that the price is bullish in the shorter run as well. Furthermore, the EMA line may act as a support structure if the price retraces at the same rate.
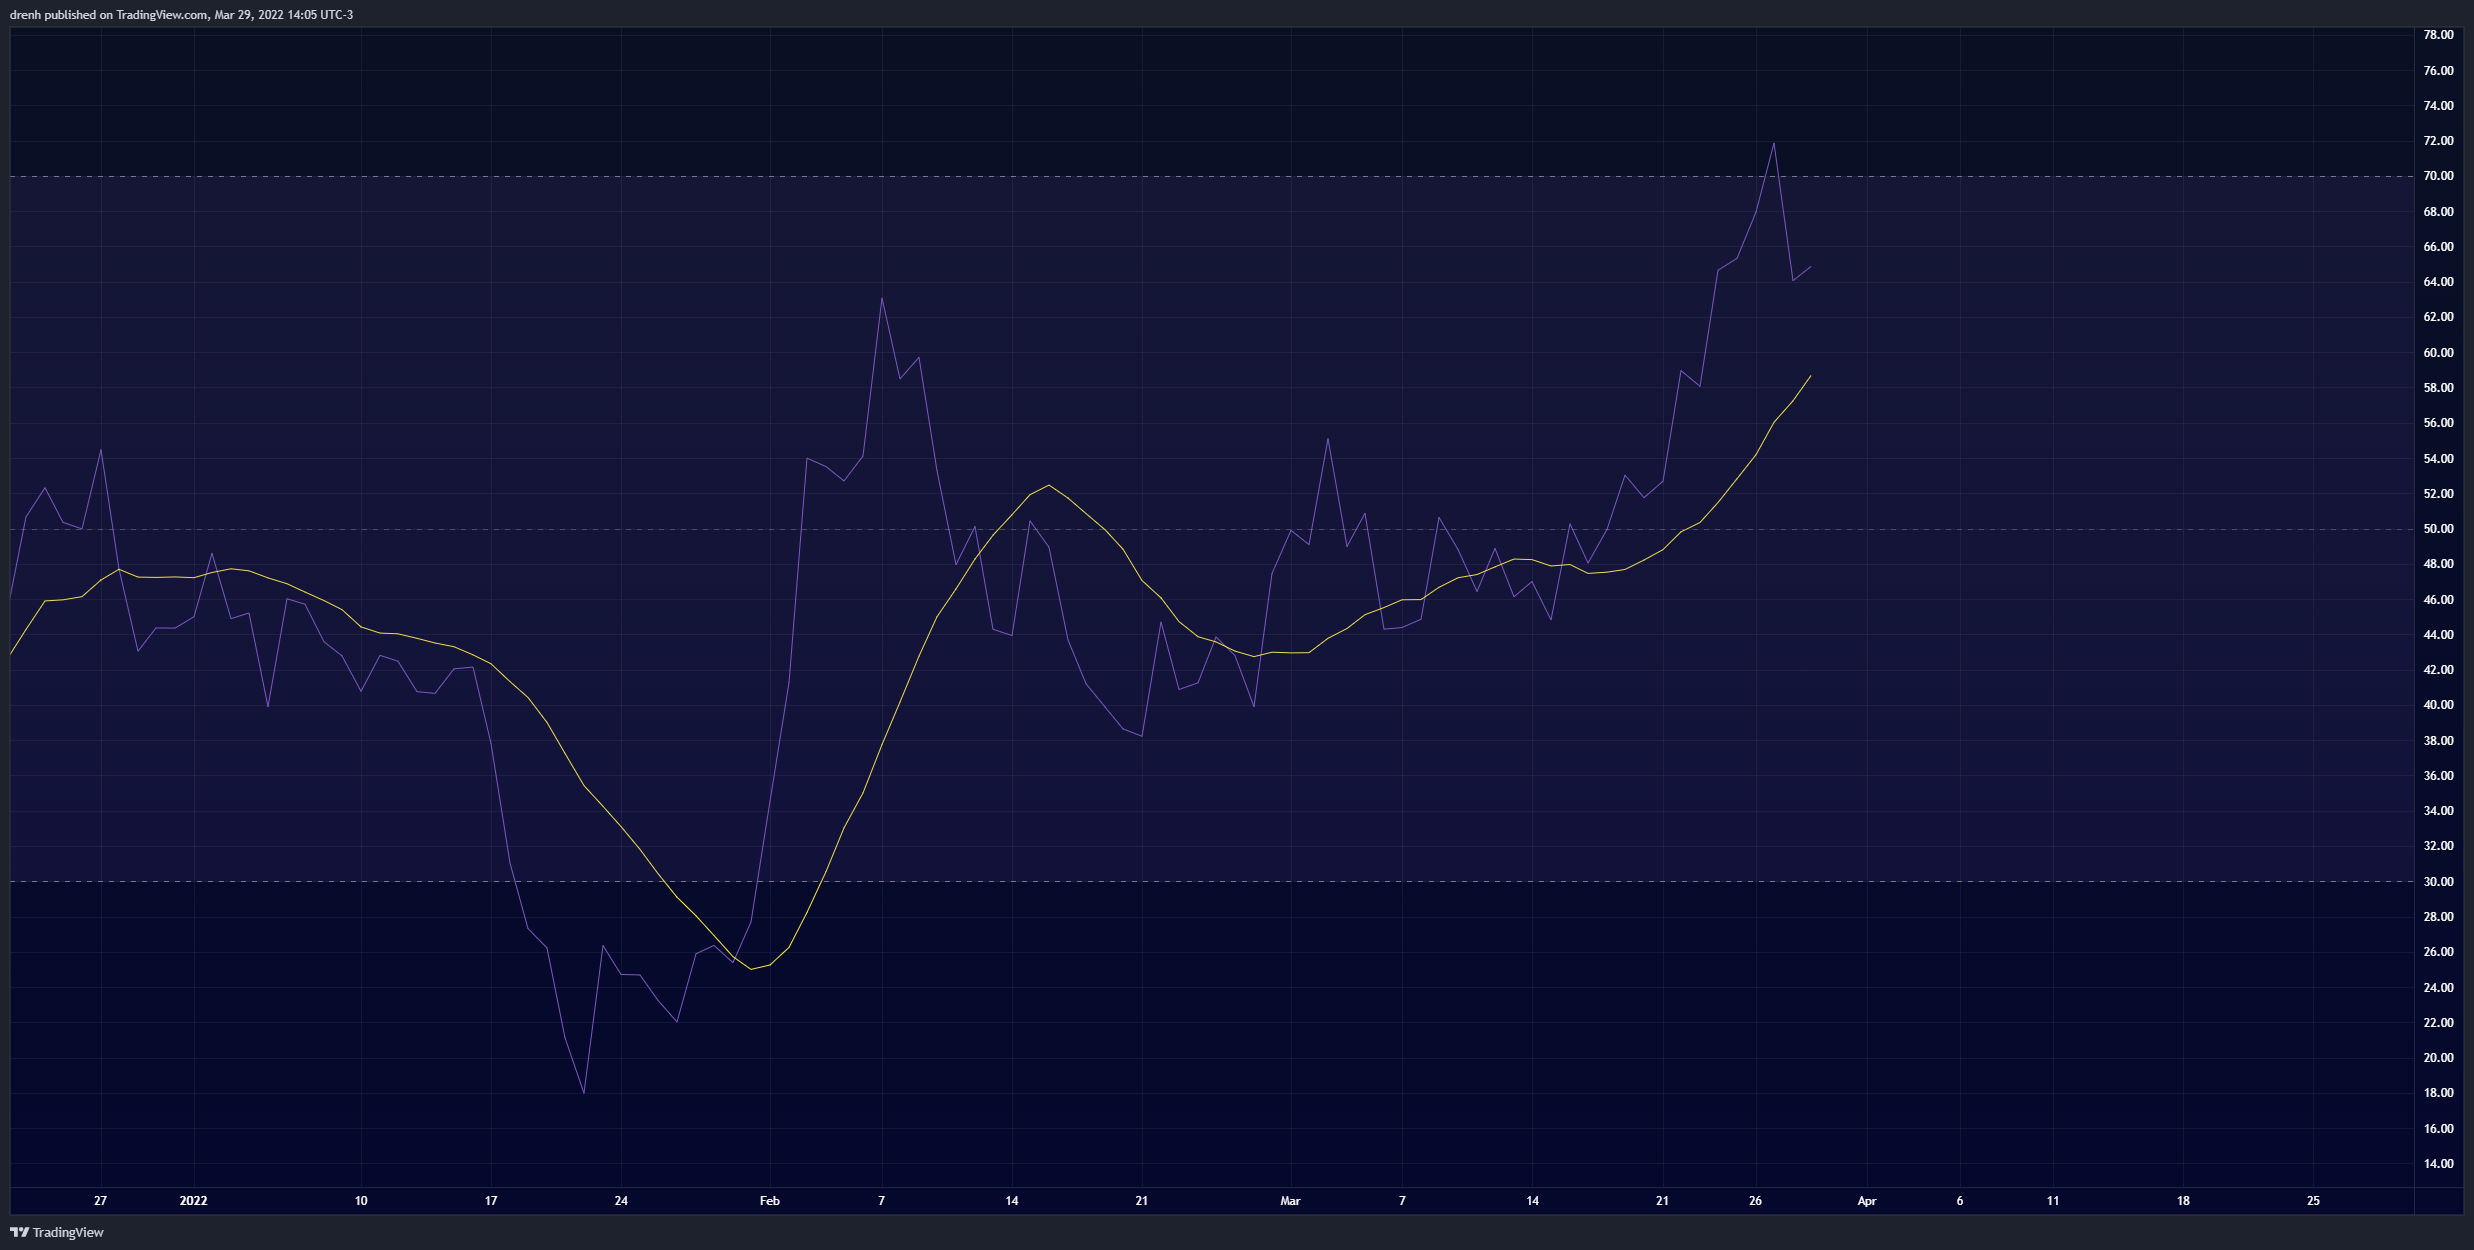
Relative Strength Index
The RSI of a 1-day chart recently hit above 70, meaning that QNT got overbought. Hence, the price has slightly retraced recently. Nonetheless, this retracement could see QNT create more space for growth in the coming months of April. This also shows that the buying pressure for QNT is quite high.
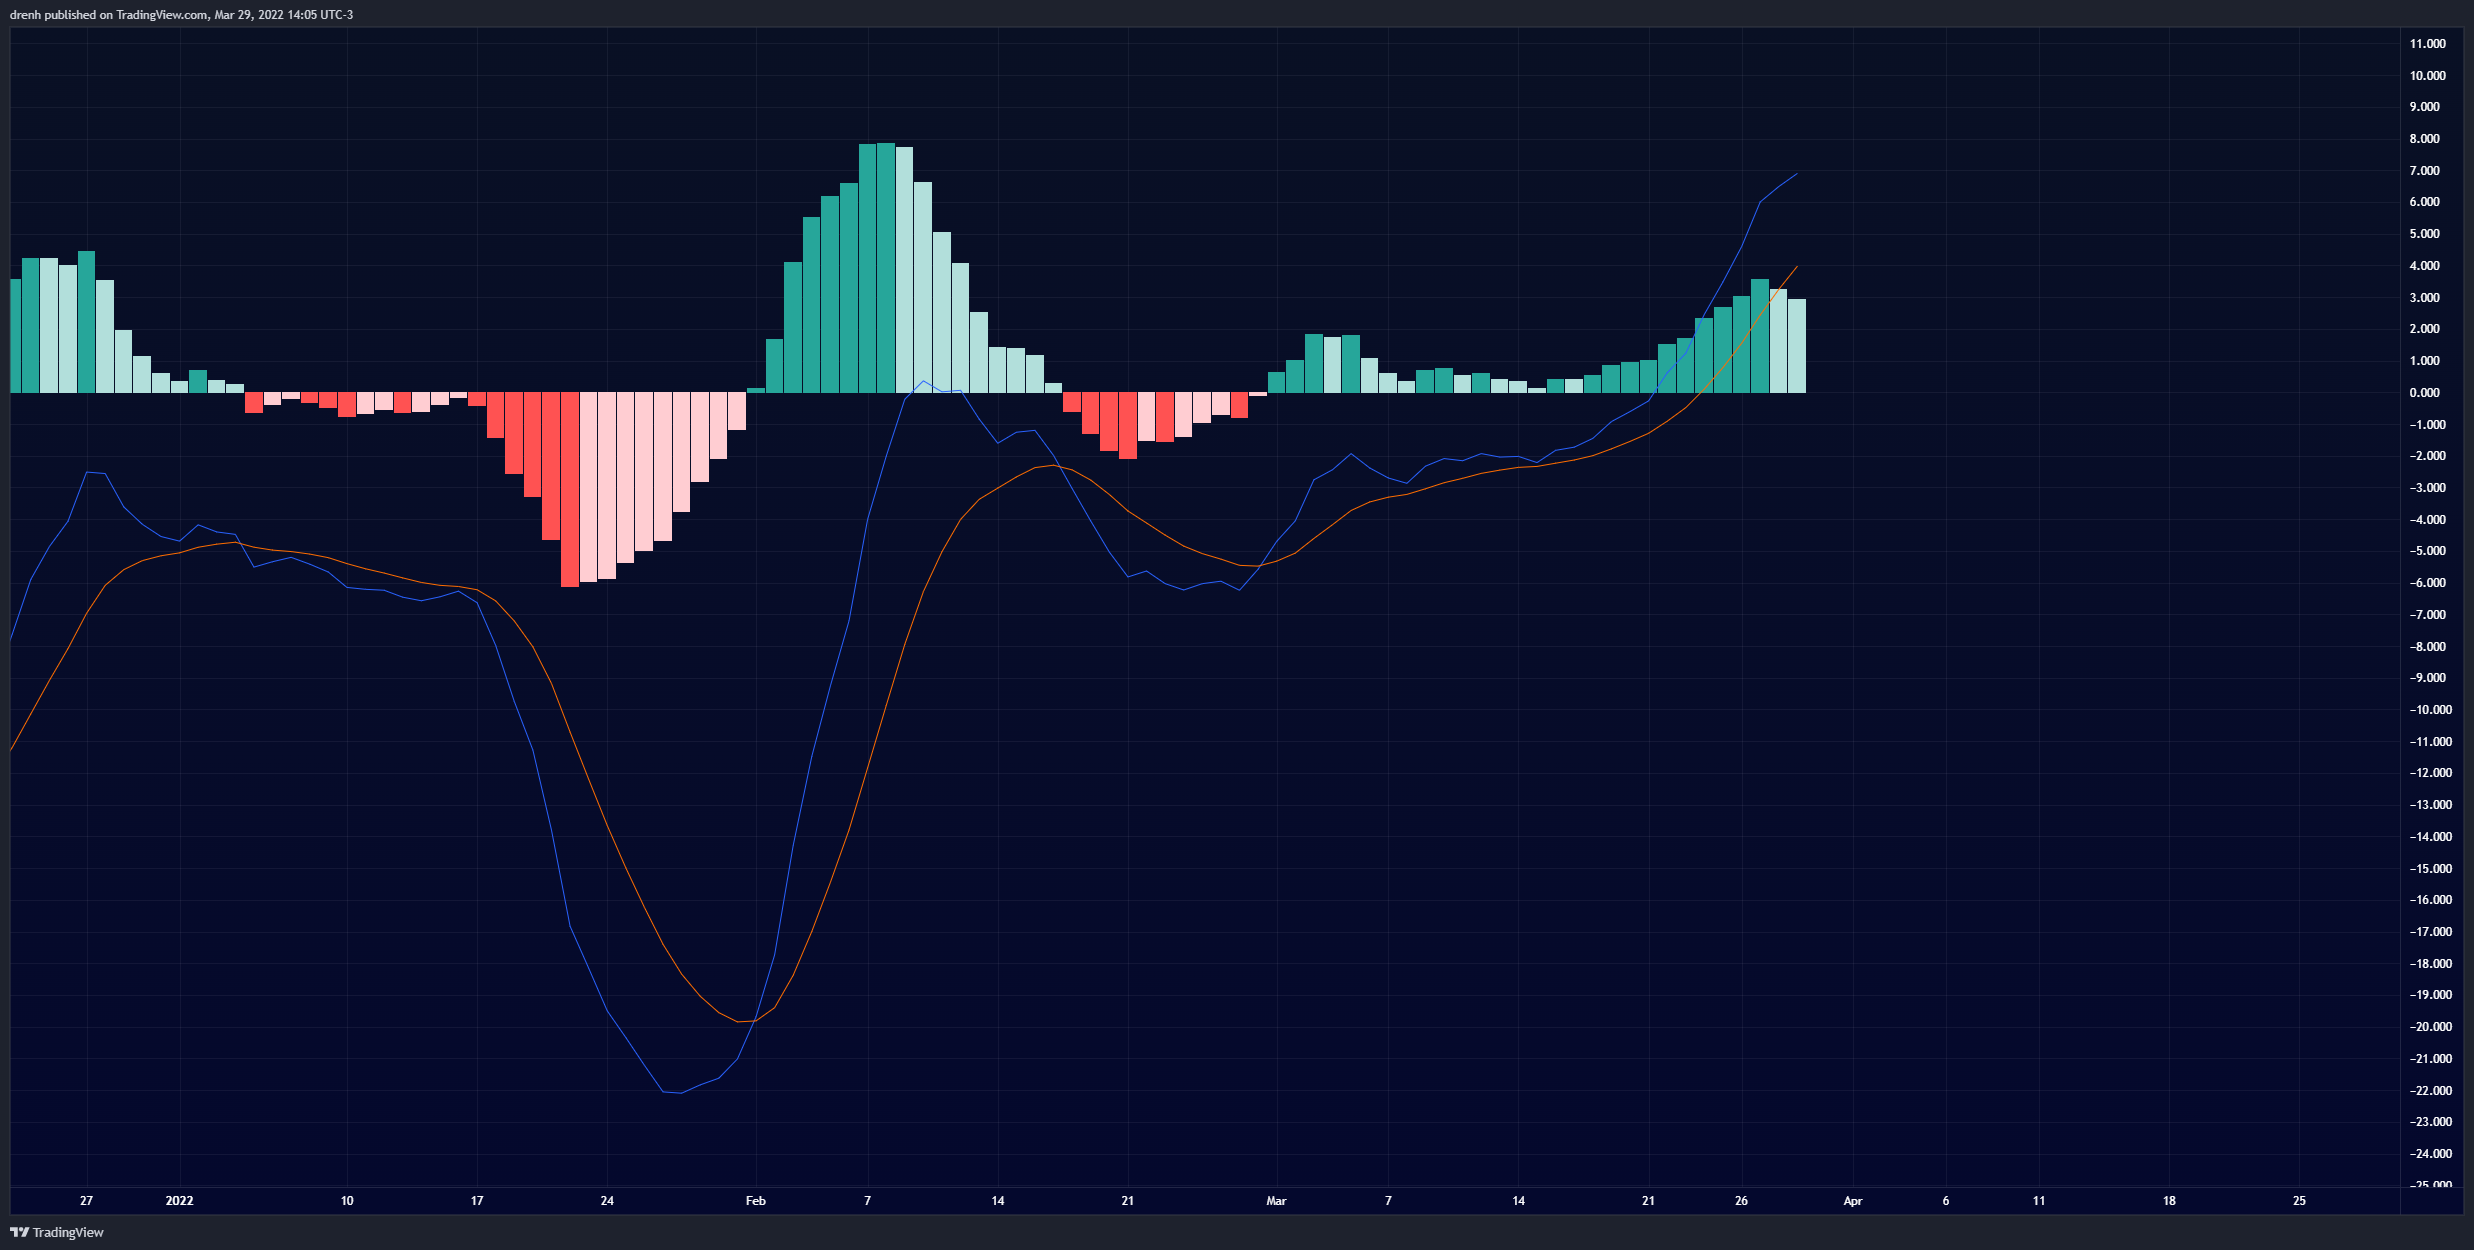
MACD
The MACD line of a 1-day chart is currently above the signal line and above the baseline, indicating that the momentum is quite bullish for Quant. This could see the price of QNT continue growing at the same rate. Nonetheless, the lines are now slightly converging, meaning that if the retracement becomes more acute, then the momentum may easily shift into a bearish one.
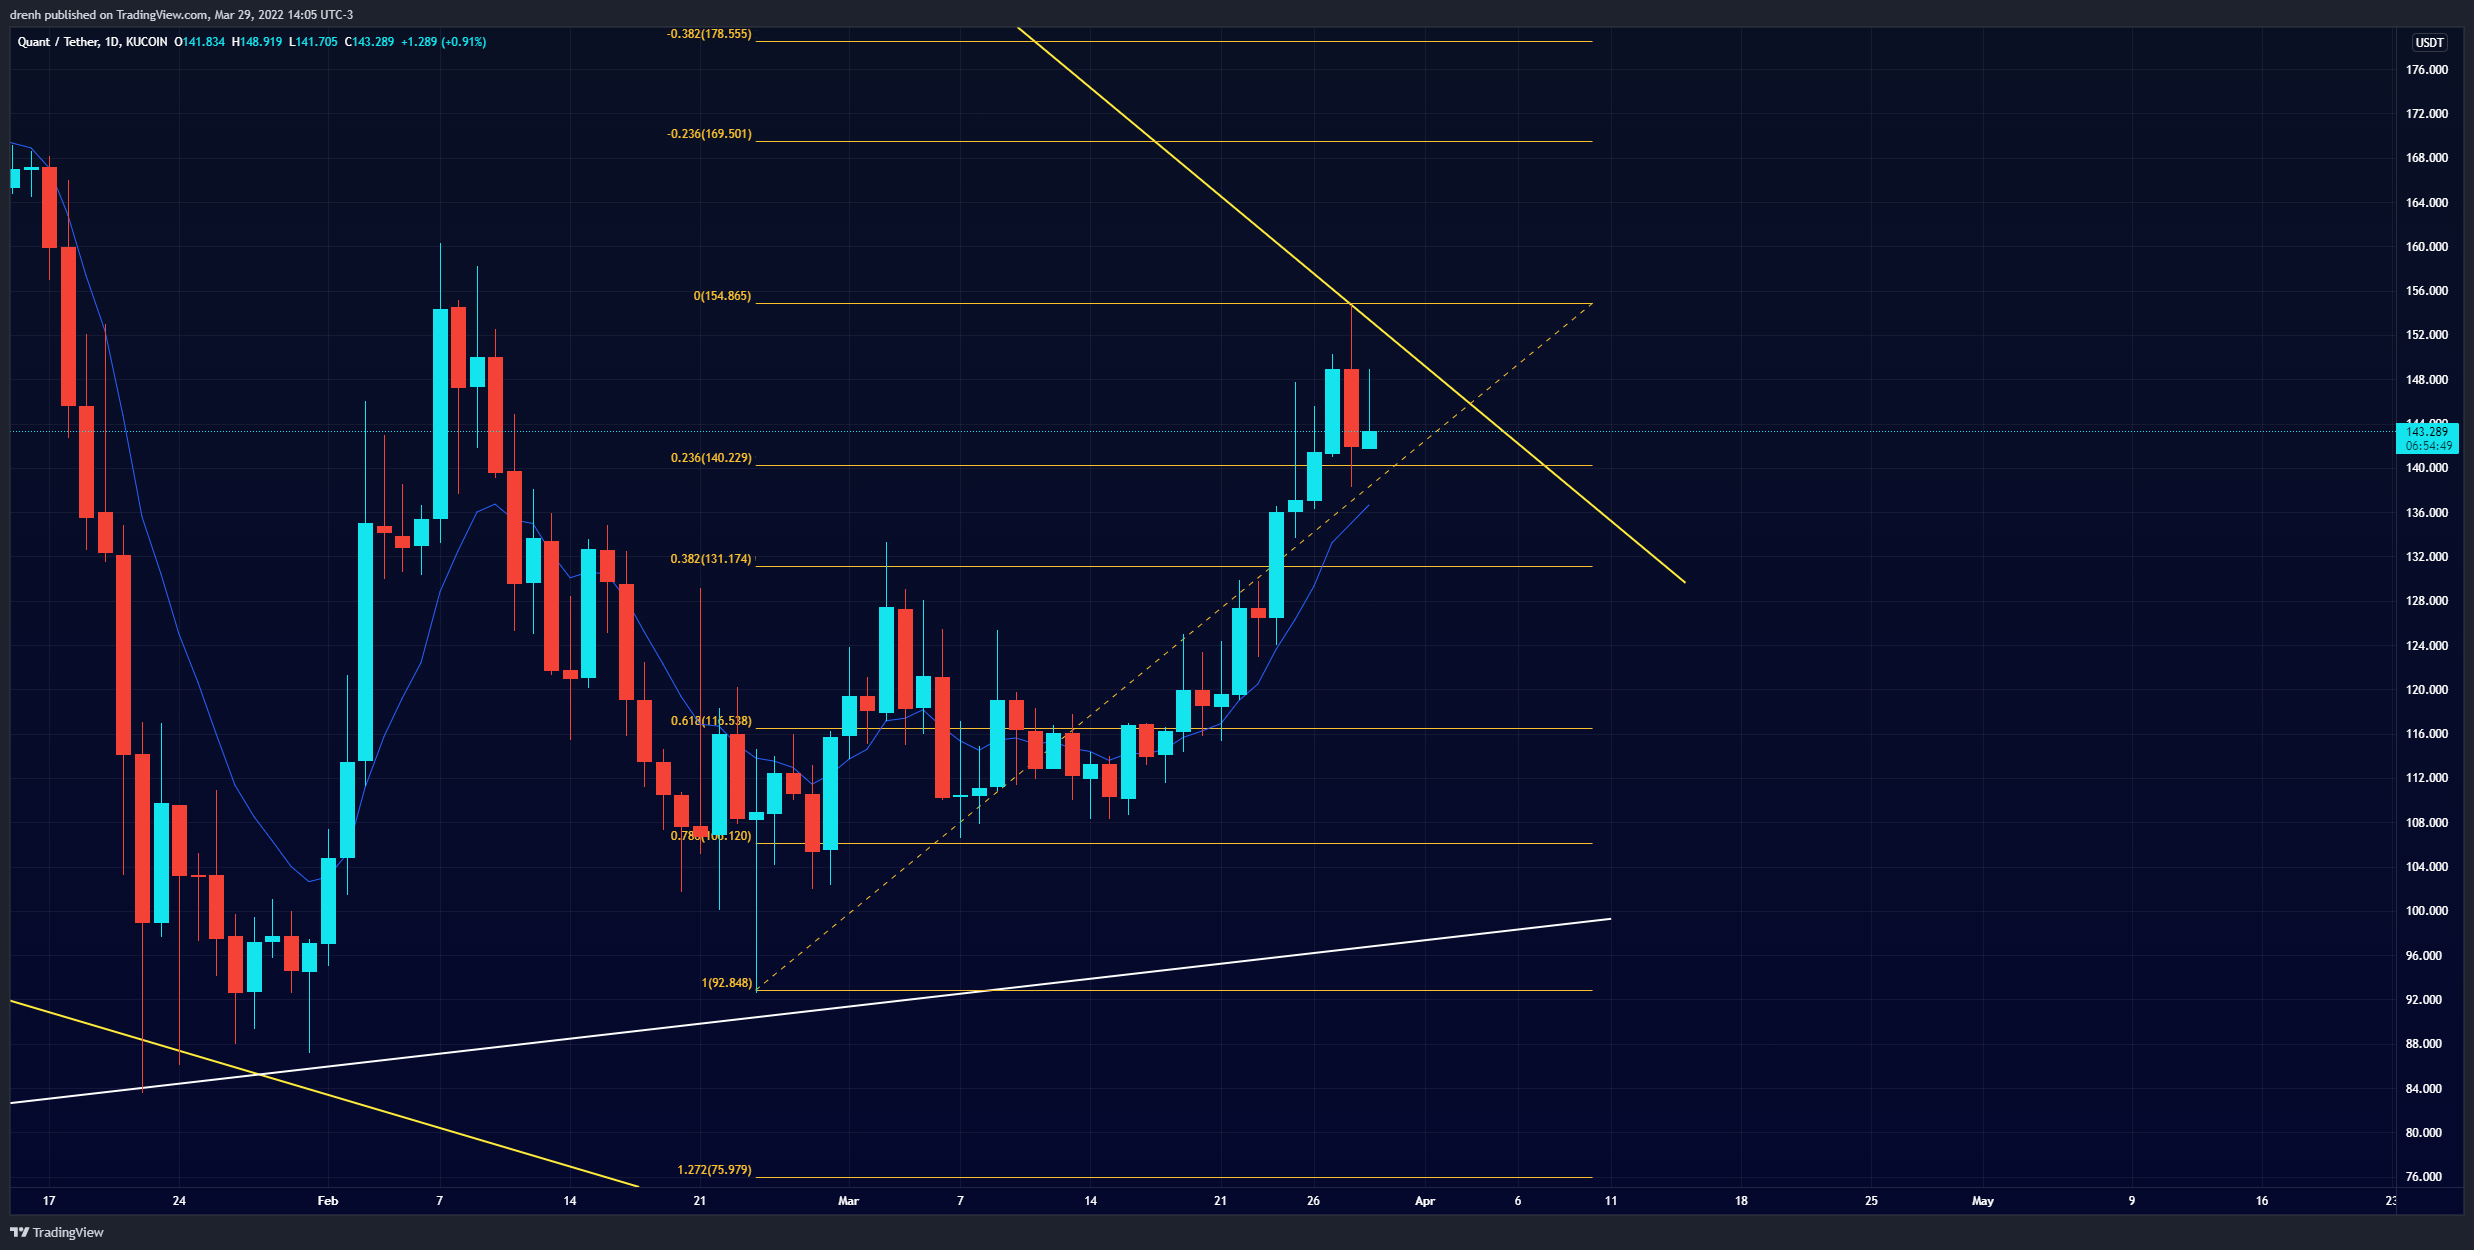
Fibonacci
The Fibonacci retracement levels for a 1-day chart suggest that if QNT retraces in the coming days, then QNT may find strong support at the 38.2% level, which also aligns well with the previous resistance structure. If that happens, then we may see QNT have yet another surge upward in the coming weeks.
Price Prediction QNT – April 2022
Based on this technical analysis on Quant (QNT), we could see QNT have quite a good few weeks in April. Assuming that the market moves in this manner and QNT maintains its bullish momentum, then we may see QNT head further high. While a retracement is bound to happen soon, that could only lead to bigger gains for QNT as it creates more room for growth. Other things equal, we may see QNT hit $200 in the next few weeks. A price of $300 is also attainable if BTC manages to keep growing at the same rate as it has in the last few days.
Latest News for QNT – Affecting Price
Quant’s Distributed Ledger Technology, Overledger, has put out a new update recently. This update focuses more on smart contracts and how developers can efficiently utilize burning and minting within the Quant network. The newly introduced tier-two QRC-20 tokens power this update, helping QNT go a step further into global scalability.
Our new release of #Overledger 2.2.2 brings new tier-two #smartcontract capabilities to mint and burn tokens and account management.
Read more: https://t.co/OJlpODw4yX#Interoperability pic.twitter.com/Ij9W38Dll9
— Quant (@quant_network) March 24, 2022
As for Quant’s goal for global scaling, the CEO of Quant Gilber Verdian will speak at the FT Digital Assets Summit, where they will discuss many aspects of globalization in the financial sector. Moreover, a key point may relate to Central Bank Digital Currencies (CBDCs) and their implementation process globally. Obviously, CBDCs may have a huge impact on the world as the nature of the economical landscape may change with the former’s implementation. Hence, with Verdian appearing in such summits and with Quant continuing to aim for a globalized, decentralized financial system, Quant may have much more institutional exposure. This could see the price of Quant (QNT) increase in the coming weeks.
On #CBDCs, @gverdian says, “at the start, we need to consider how to integrate our existing financial systems with DLT and blockchain-type payment systems to support the evolution of money.”
More here: https://t.co/hh8aLeFkSy pic.twitter.com/FRoUR7c1By
— Quant (@quant_network) March 24, 2022
 Surges Post-Bitcoin Halving")

