
EGLD Technical Analysis – November 2021
Monthly Analysis
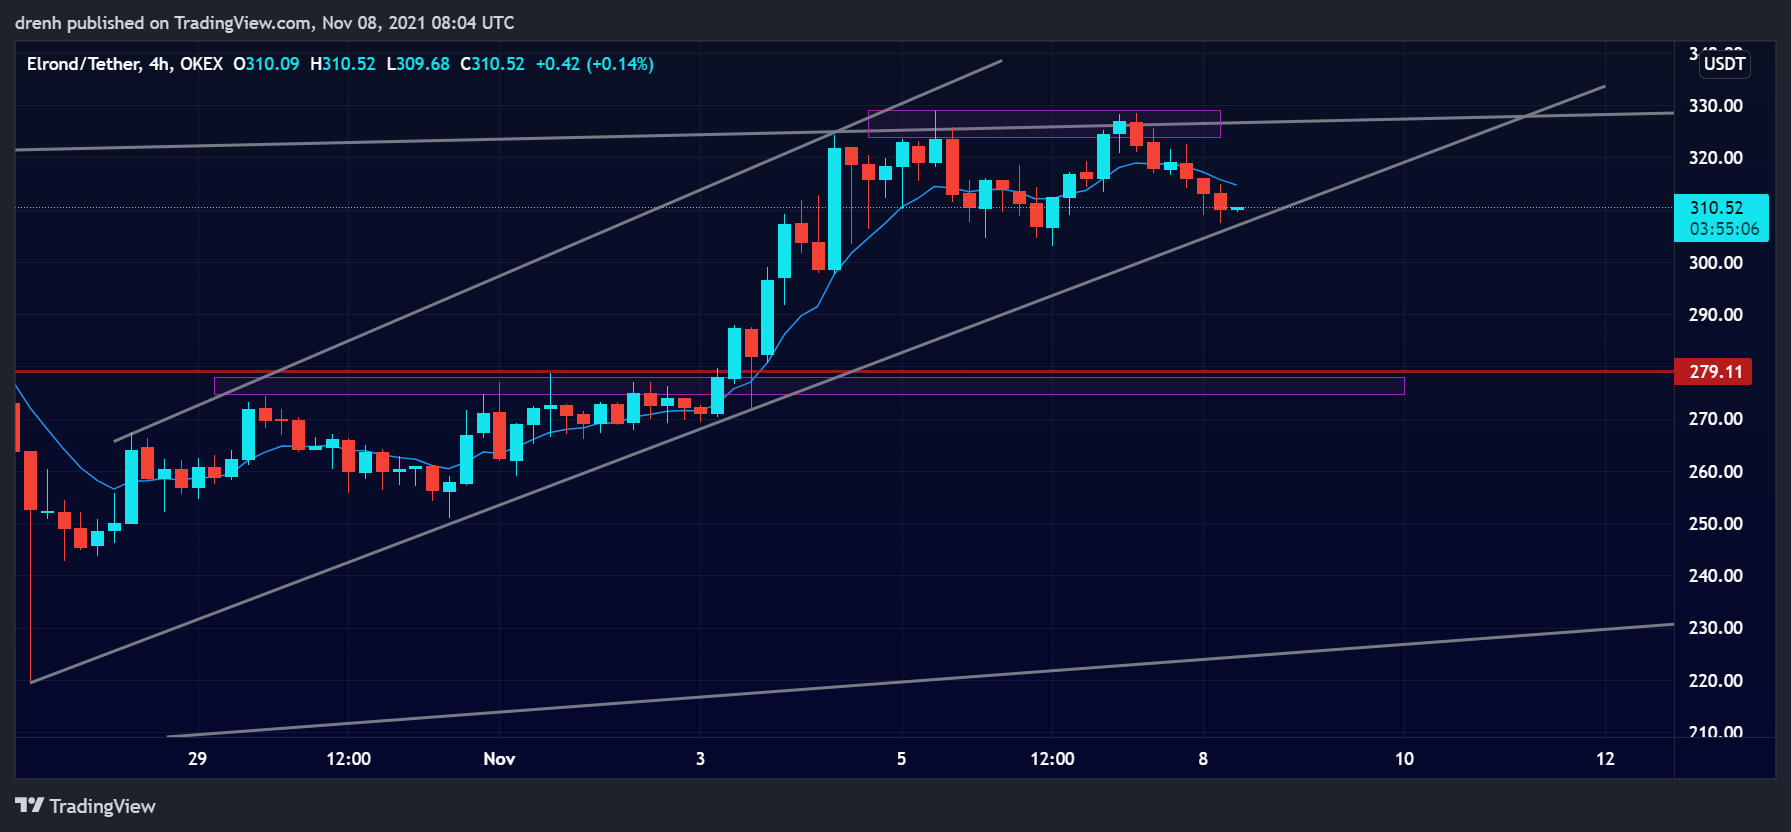
Over the last 30 days, EGLD initially increased by around 36%, but it then had a bearish breakout of 26%, making everyone think that EGLD would now be in a bearish run. However, investors bought the dip and have increased the price of EGLD by 49% after that, reaching an all-time high at around $329.
Weekly Analysis
In the last 7 days, EGLD has been bullish. The price has increased by 27%, reaching a new all-time high for Elrond. However, the price has found support at $329 twice, creating a double top. If this pattern is respected, then we could see the price of EGLD further retrace in the coming days.
Daily Analysis
In the intraday chart, EGLD has been bearish, and the price could further decline in the coming hours. In the last 24 hours, the price has retraced by 5%. We could see EGLD soon find support as investors can buy the dip again.
Key Structures
Support
- $302
Resistance
- $329
Indicators
Moving Average
The 20-day moving average is quite below the price, indicating that the trend is upward and bullish. This suggests that the price of EGLD could keep increasing in the coming days.
The 9-day EMA is also below the price, indicating that the price of EGLD could keep increasing and that the EMA line could act as support if the price retraces.
Relative Strength Index
The RSI of a 1-day chart was recently close to the overbought region, and it has slightly declined. However, this suggests that EGLD has now more room to increase.
MACD
The MACD line is above the signal line and above the baseline. This indicates that the momentum is bullish for EGLD and that the price could keep increasing in the coming days.
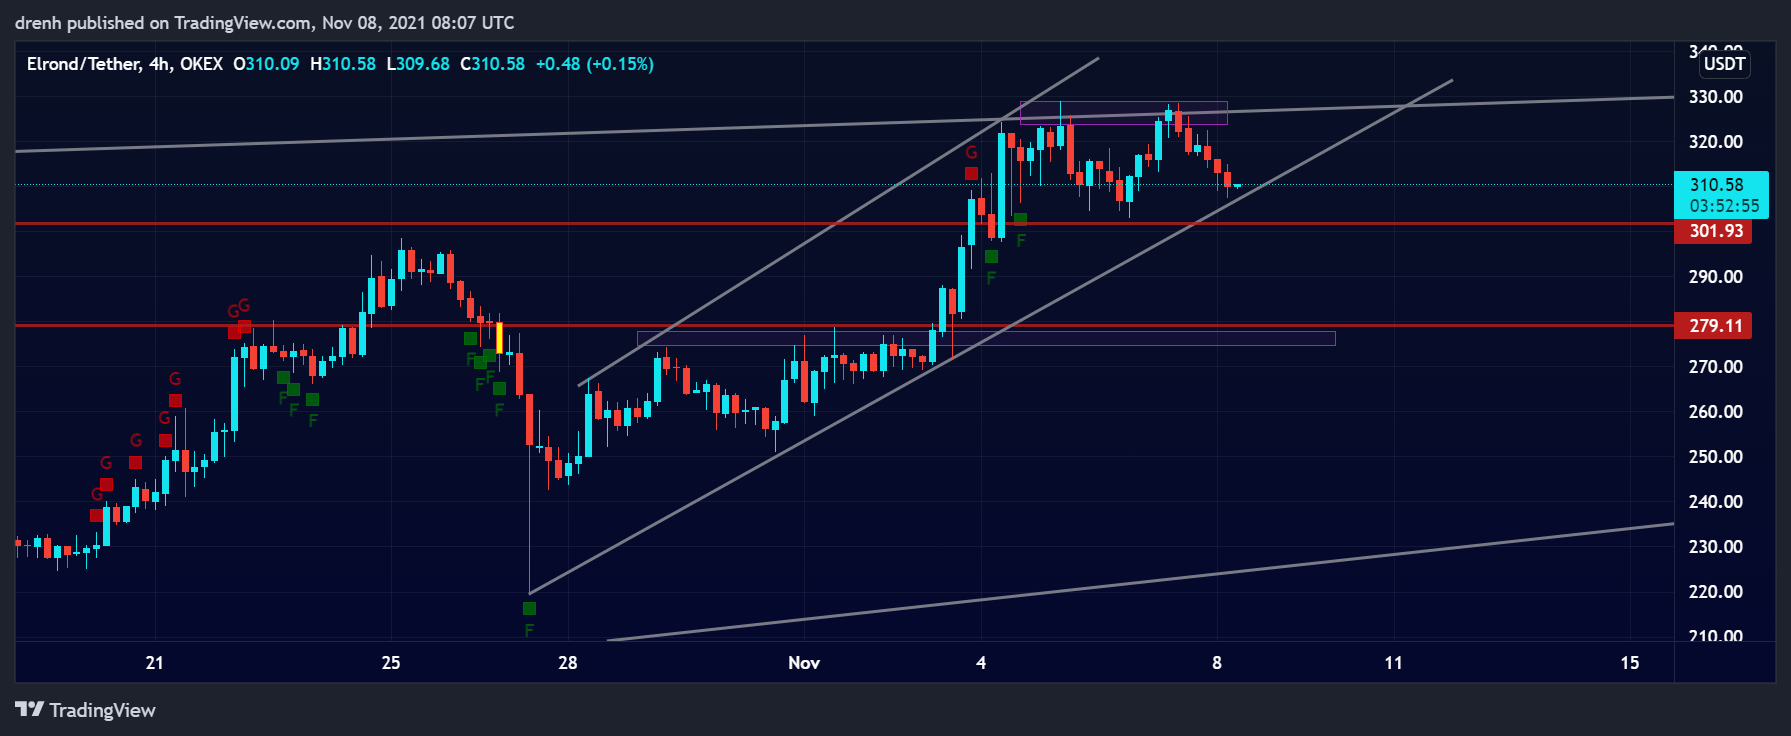
Fear & Greed
The fear and greed indicator of a 4-hour chart suggests that the current emotion of EGLD traders was recently fear, and traders were not too greedy when EGLD hit the all-time high at $329. We could expect fear in the short run as the price continues to retrace.
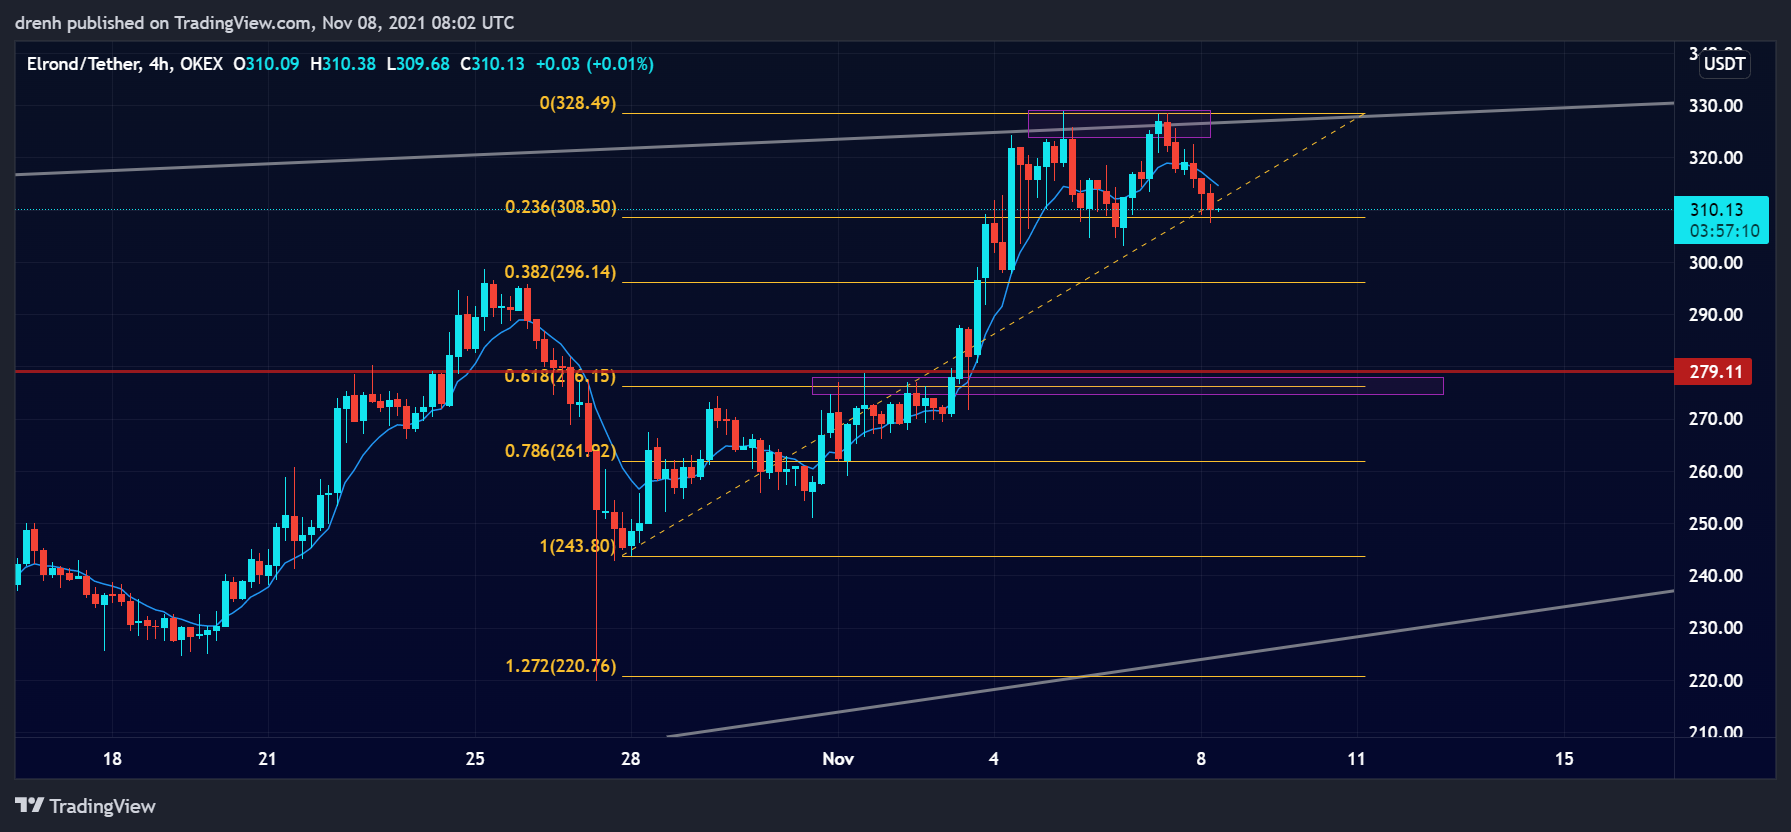
Fibonacci
The Fibonacci retracement levels suggest that the price could now retrace in the coming days to one of the levels, and it is currently testing support at 23.6%. The 61.8% level could be a stronger support zone as it also coincides with previous resistance structures.
Price Prediction EGLD – November 2021
Based on this technical analysis on Elrond (EGLD), we could see its price further retrace in the coming days if it fails to find support at $302. Since a double-top pattern has taken shape, we could see the price retrace to around $277 before EGLD continues its bullish run. EGLD could reach a new all-time high in the coming weeks. A price of $500 is only feasible in the long run as BTC maintains its momentum and approaches $100,000.
Latest News for EGLD – Affecting Price
Elrond (EGLD) has recently hit an all-time high and was in price discovery. While many might forecast that the bull cycle could end soon, Raoul Pal has recently suggested that the cycle could be extended with ETH 2.0 update coming soon.
Also read: Elrond (EGLD) Price Prediction 2021 and Beyond – Is EGLD a Good Investment?