

What started as a fun meme coin eventually turned into an evolutionary move for the cryptocurrency sphere. Our Dogecoin price analysis reveals the token is currently going through a reverse head and shoulder movement following the overall market movement and is likely to stay stable.
Just like other top cryptocurrencies, the year-to-date (YTD) high was hit on the 14th of January at the $0.194 mark. Since then, the altcoin price movement loosely followed the overall market momentum. It is, however, evident from our previous price analysis that the cryptocurrency sphere is now observing a much quicker movement shift from one coin to another.
As soon as one coin drops, traders start pumping money into the next to make their ends meet. Bitcoin, Ethereum, and Ripple where stand at the top; the lower level coins in the top list serve as the second tier, and coins like Dogecoin as the third tier investment and trading option.
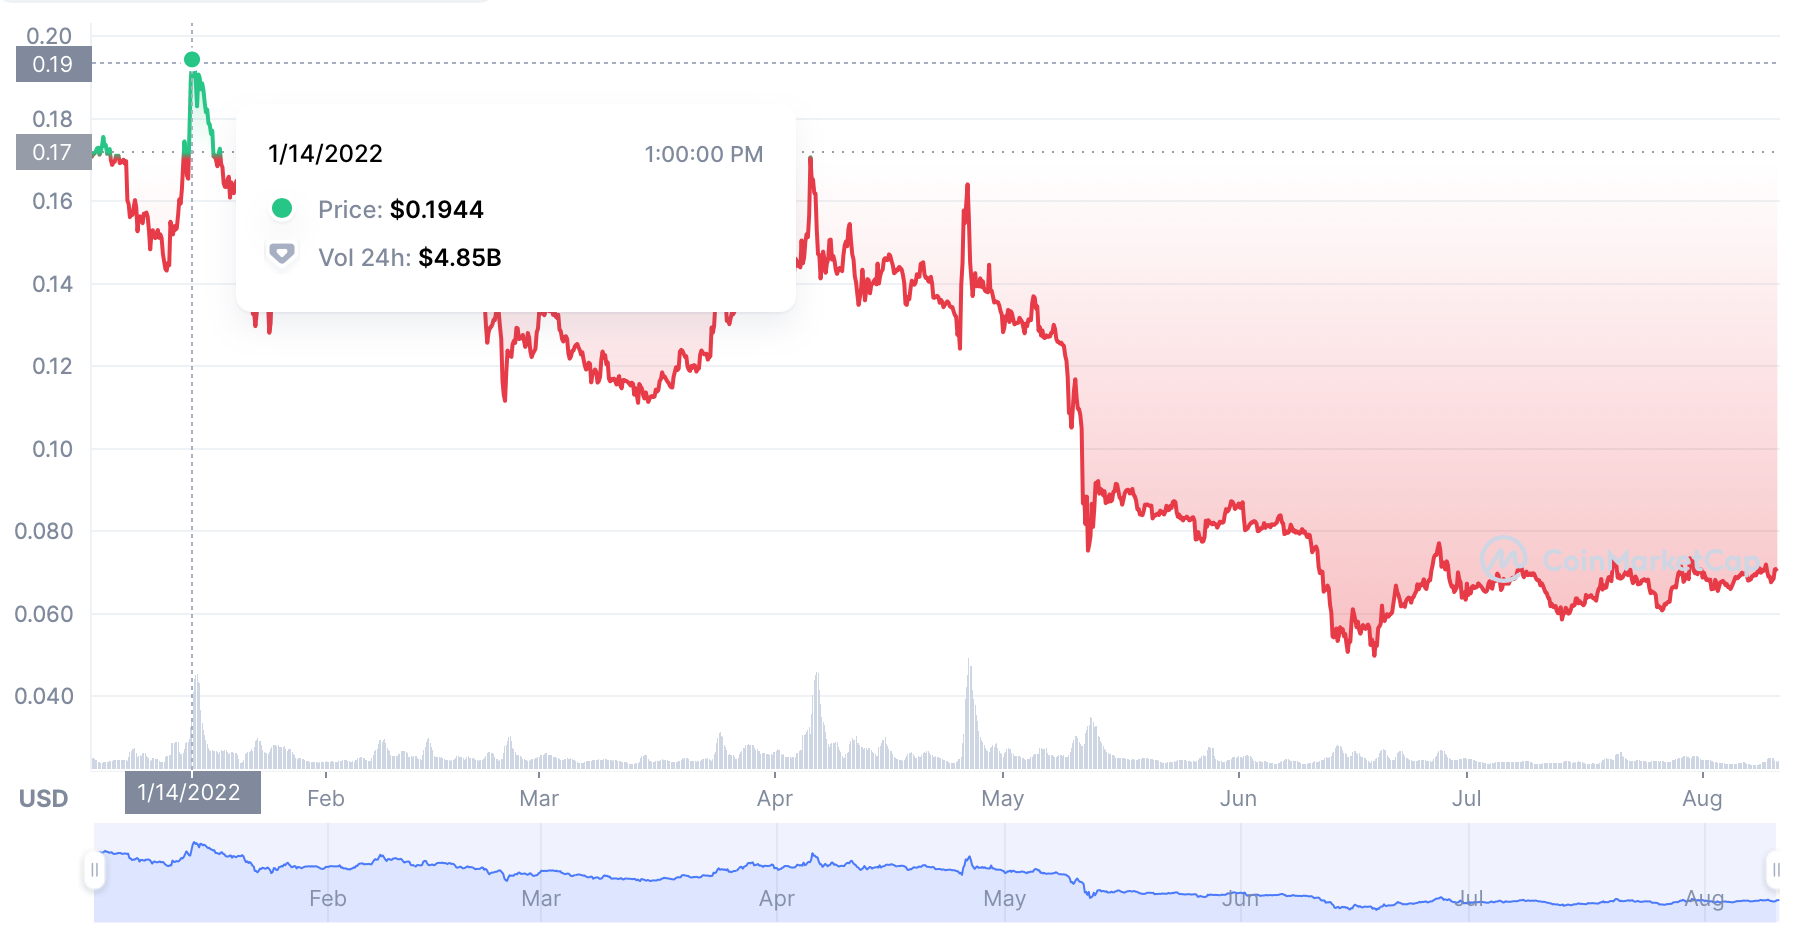
Dogecoin price chart by CoinMarketCap

Since the YTD high DOGE price has managed to get out of trouble in April and May when it hit the $0.17 and $0.16 marks respectively. Since then the coin did not manage to break free of the overall down market trend settling bellow the $0.10 mark for a long time.
Dogecoin Price Analysis: DOGE moving into reverse head and shoulder after retrace
Dogecoin price is moving as per the newest of market trading trend. It is mostly that of a pump and dump. The price went high up after an over buying streak on the 10th of August and then fell back down with an over selling streak right after the price was primed for a sell move.
However, just like Cardano price movement, this move turned into a favorable pattern for the cryptocurrency, however, not without some push from the buyers again. Buyers managed to hit the relative strength index (RSI) score of 75 right where the head ends and the final shoulder starts to form.
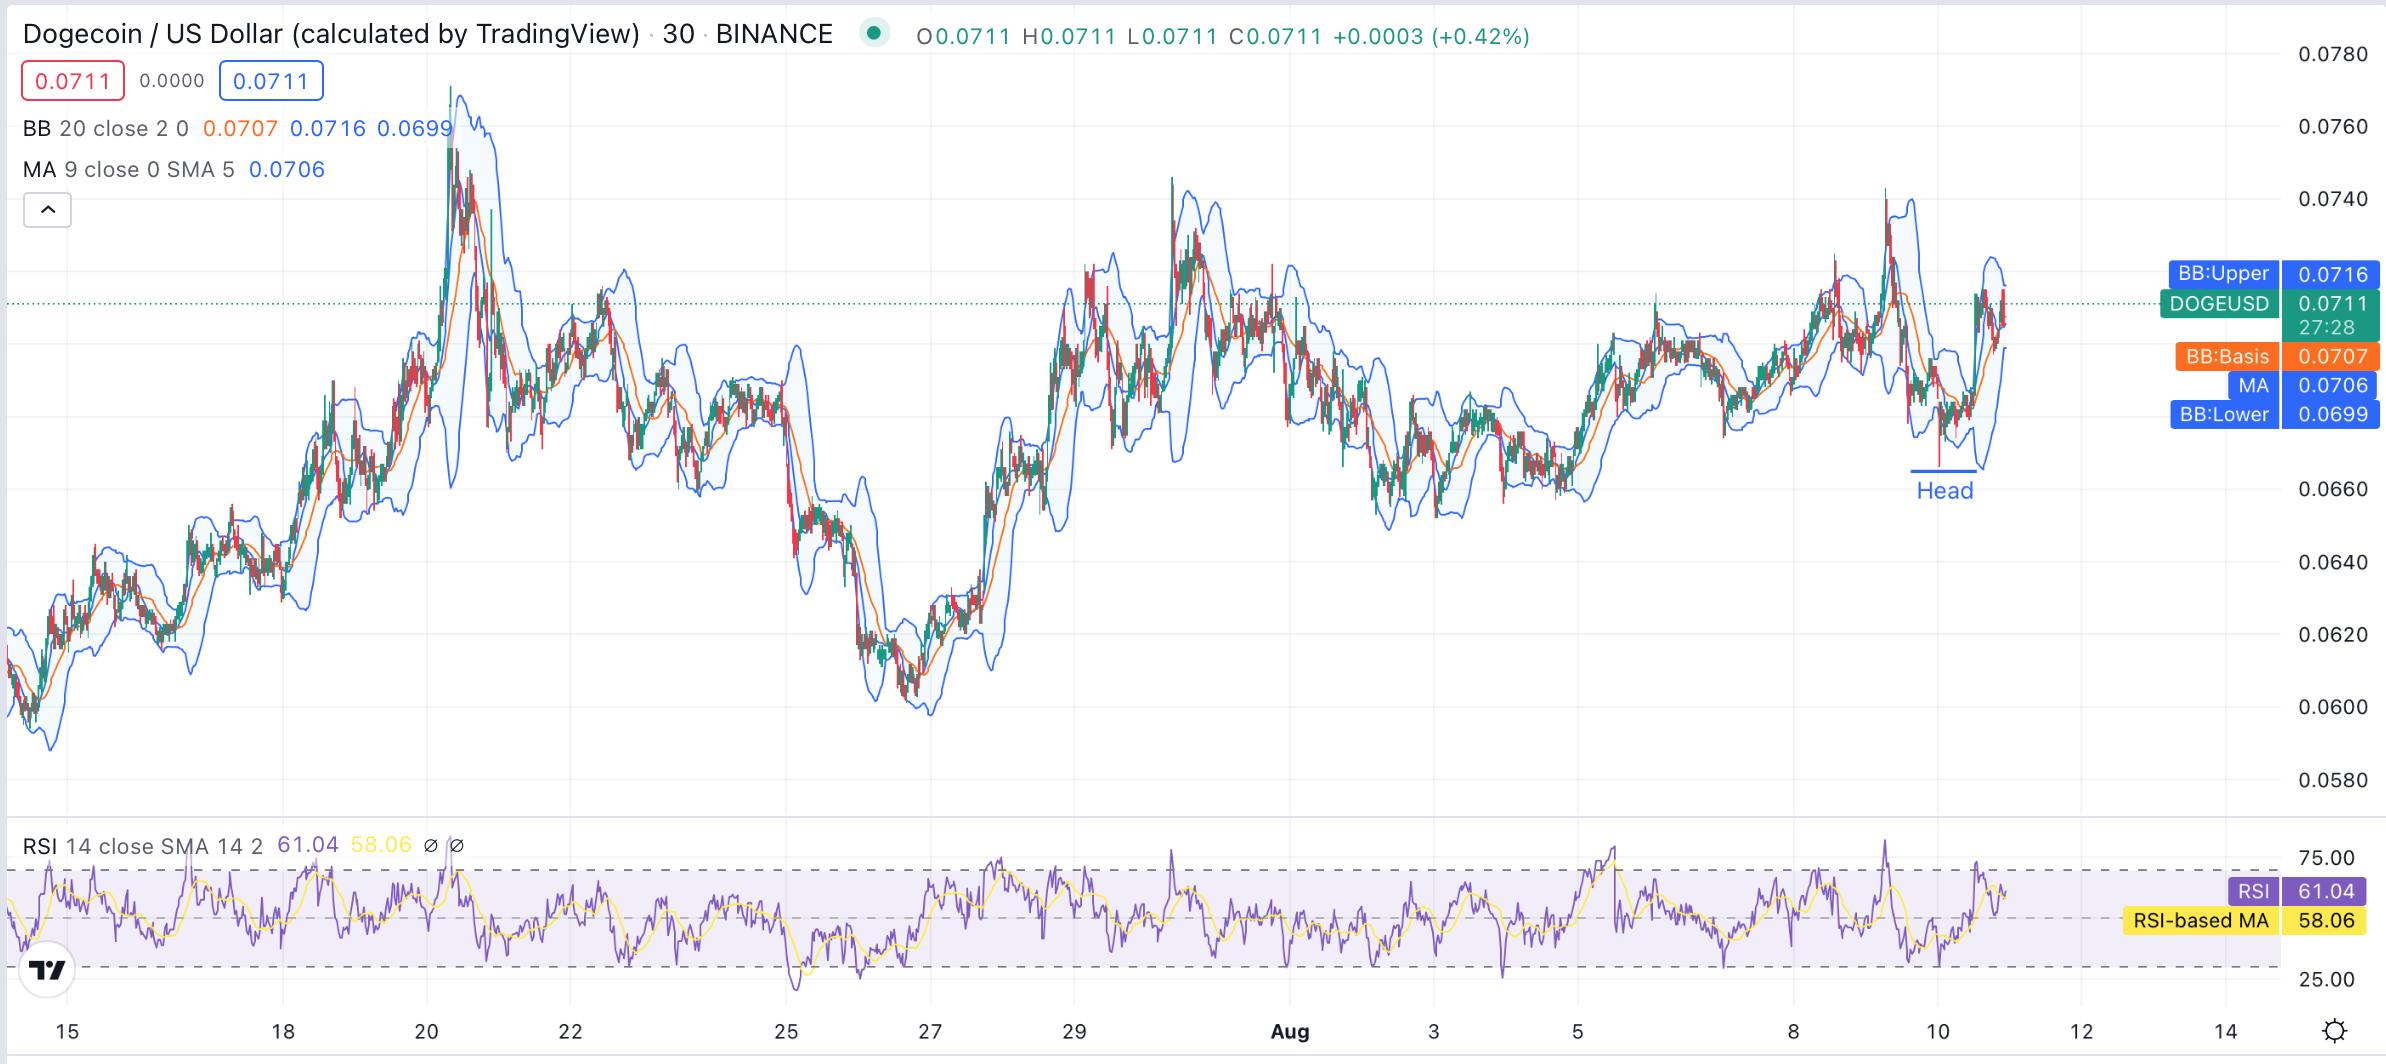
Dogecoin price analysis chart made with TradingView

At the time of writing, the Dogecoin price stands at a bullish $0.0711, with the RSI score now standing at the 61.04 mark, i.e., leaning towards the overbought zone. However, the RSI moving average (MA) stands slightly lower at the 58.06 mark, showing some sign of stability.
The Bollinger Band average (BB: basis) is currently providing strong support at the $0.0707 mark, and the moving average (MA) is providing the second strongest support level at the $0.0706 mark, while the Bollinger Band lower limit is providing the strongest support at the $0.0699 mark. The only resistance is posed by the Bollinger Band upper limit found at the $0.0716 mark showing some stability in the price movement.
Dogecoin price movement depends on the buy/sell trend, as that appears to be the overall deciding factor in the current market. These trends are driven more by global economic and political events than by the events happening within the cryptocurrency sphere. DOGE is likely to finish the reverse head and shoulder formation in the current scenario with a calm rest of the week. However, any pump and dump action can sway the price higher.
Take Aways
- Dogecoin price facing pump and dump actions as overall market trend.
- Dogecoin price is in bullish momentum.
- Reverse head and shoulder formation signals further rise.
- Another pump and dump attempt can sway the price higher.
- Market is driven more by the global economic and political factors.
Disclaimer: The information provided on this page is most accurate to the best of our knowledge; however, subject to change due to various market factors. Crypto-Academy encourages our readers to learn more about market factors and risks involved before making investment decisions.