

Cardano started as an open source proof of stake (PoS) project that later inducted the BEP-20 standards as well. Our Cardano price analysis reveals that the cryptocurrency is moving into a reverse head and shoulder formation, priming for a bull movement.
Unlike top cryptocurrencies like Solana, Cardano saw the year-to-date high in the third week of January 2022, when it hit the $1.61 mark on the 18th. This is about the same time when others were in a dip. The cryptocurrency market daily trend has shifted to a quick buy/sell trend after the post-COVID-19 highs. Our price analysis of the top 10 cryptocurrencies, including Bitcoin, Ethereum, Ripple, Solana, and Binance Coin, reveals the trend breathing on the charts.
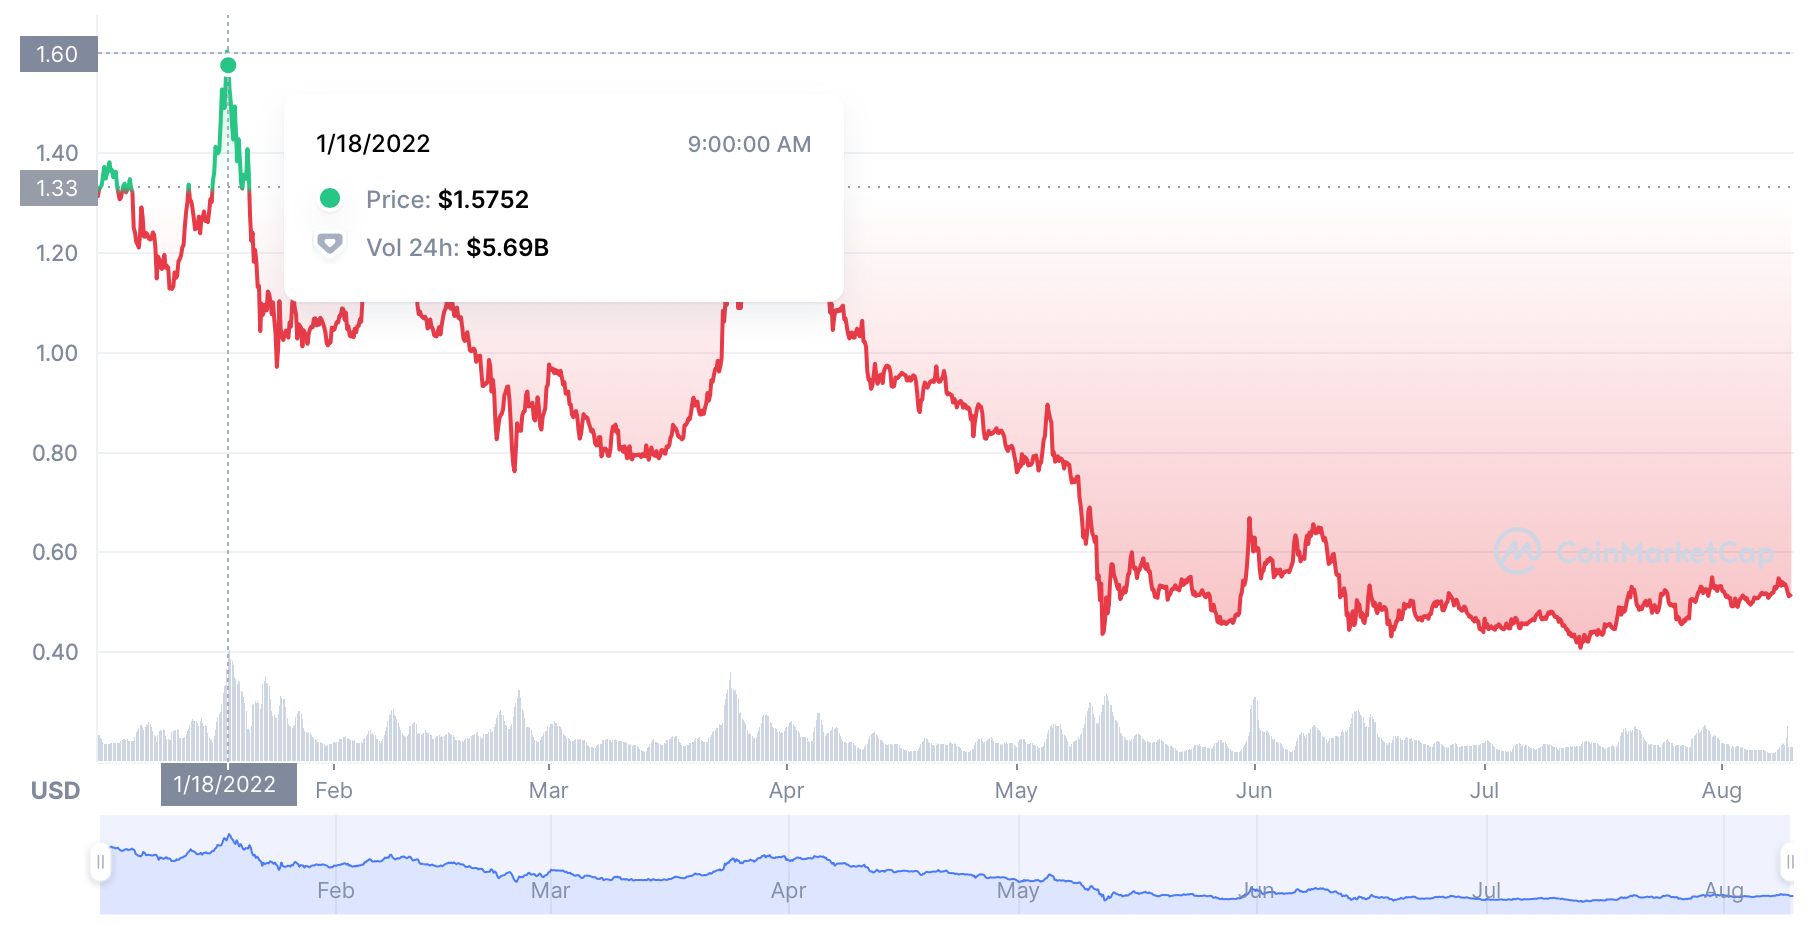
Cardano price chart by CoinMarketCap

Although the YTD was delayed by two weeks for Cardano, the cryptocurrency sent into a similar dip as the other top coins and fell as far down as to the $1 mark within January. The next few months were similar except for the exception of March, when the cryptocurrency managed to hit the $1.27 high only to follow the market into a downtrend.
Cardano Price Analysis: Reverse head and shoulder forming gives bullish indicator
In the past few hours, Cardano price movement has been quite unstable, while the overall market is no different. With a 0.27% gain in the past twenty-four hours, ADA price entered a swell on the 9th of August to the $0.547 mark only to retrace back to the current price levels.
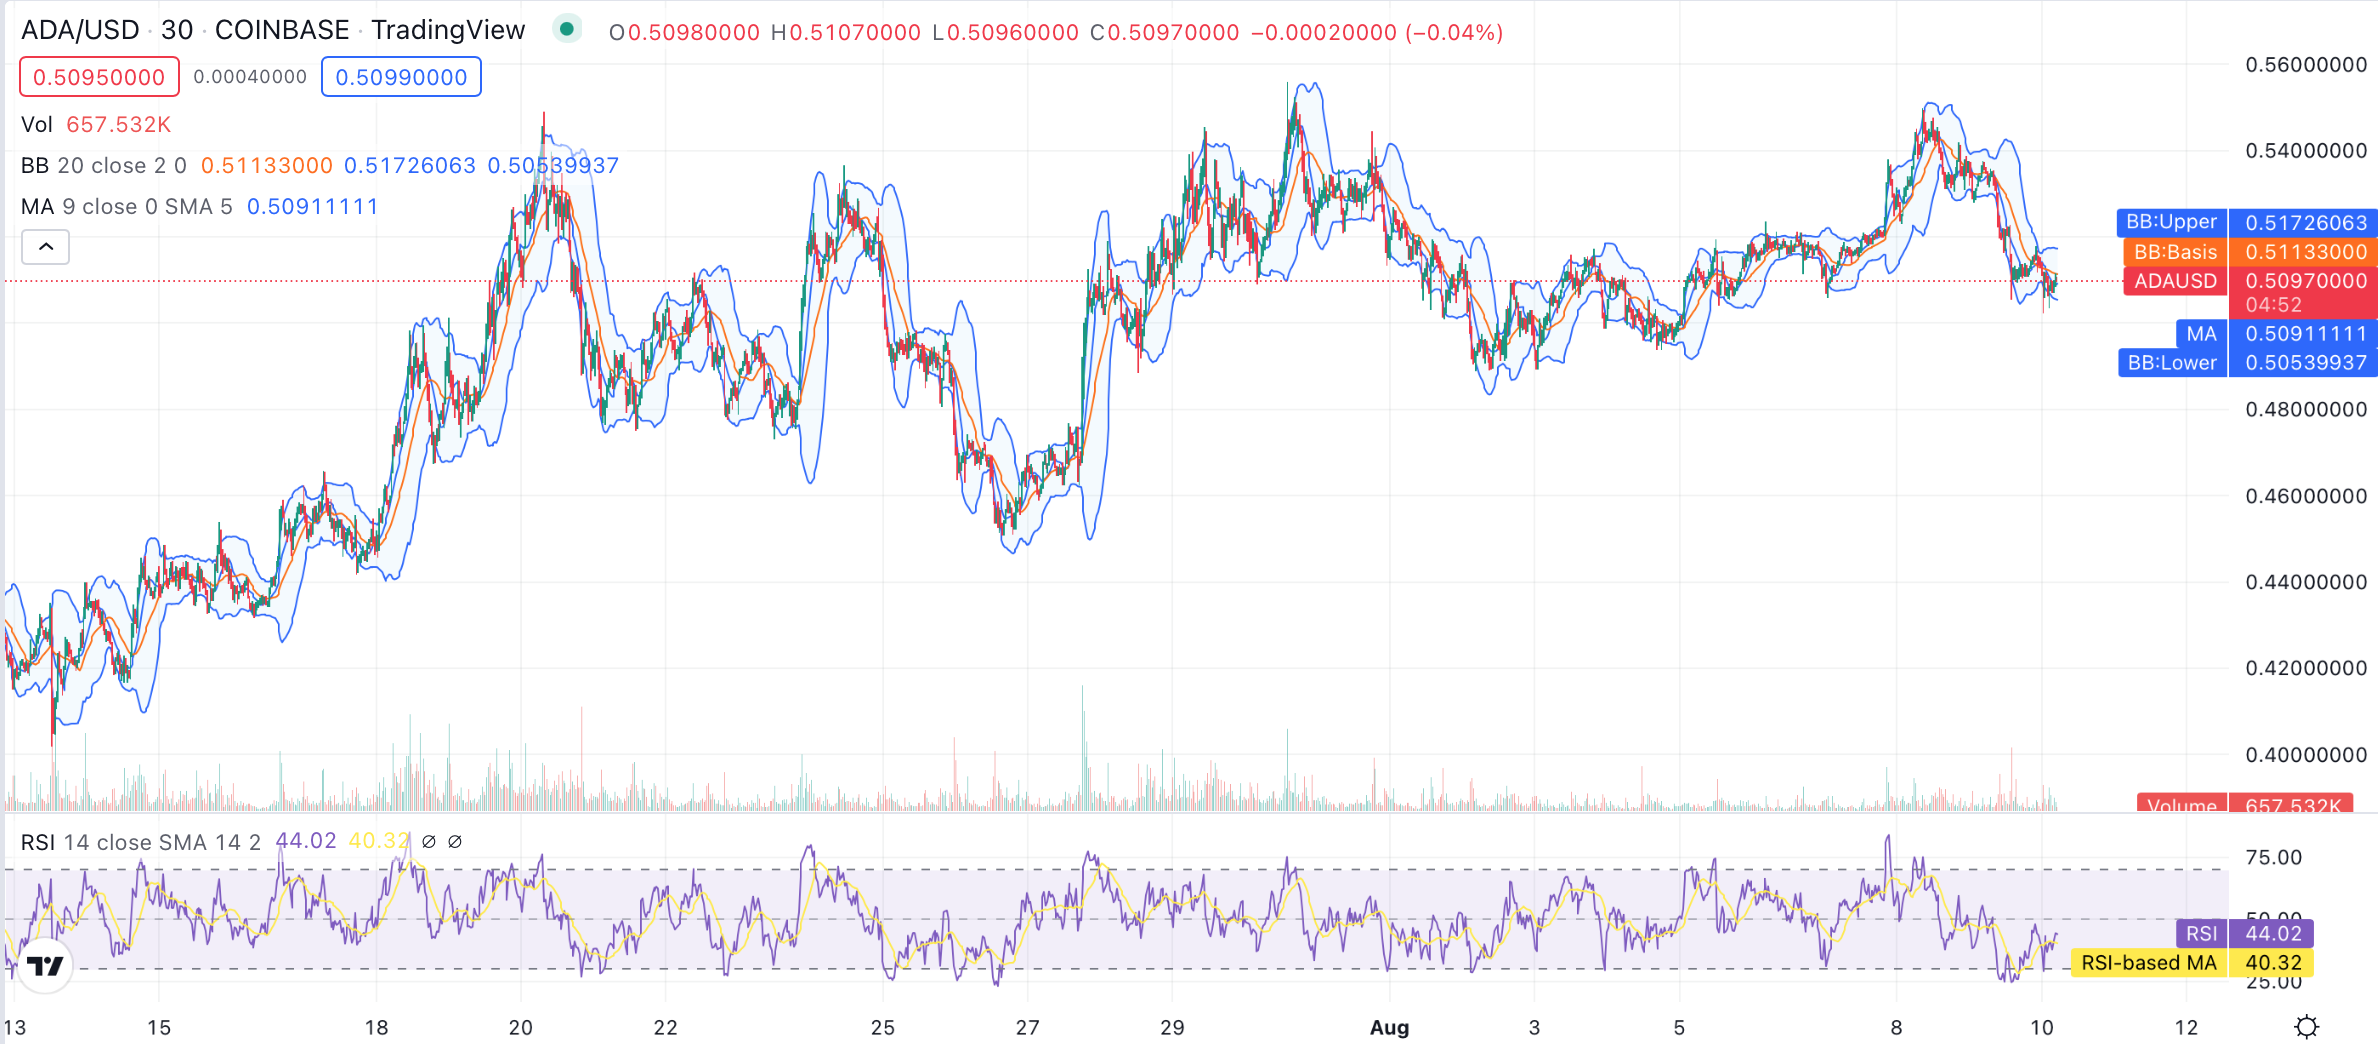
Cardano price analysis chart made with TradingView

The swell in the early hours of the 8th of August came from an unexpected overbuying streak before day end on the 7th of August, as evident from the chart above. The relative strength index (RSI) line shows a score of 83.11 just before the day’s end. The overbuying streak then converted into a price swell to the second high of the month. Although the price quickly retraced back to the current price level of $.511, the push has primed ADA price for bullish momentum.
Observing the chart closely, we find a reserve head and shoulder forming at the time of writing, with the head currently in half completion. The RSI index also shows a brief overselling streak in the late hours on the 9th of August. However, despite the streak, the momentum managed to work in favor of the current price movement. At the time of writing, the RSI moving average (MA) and the RSI score stand in the neutral zone leaning towards overselling at the 40.32 and 44.02 marks. Although chances of a quick pump and dump cannot be ignored, in which case the price can sway and fall further down to the $0.490 levels.
Bollinger Band upper limit poses the strongest resistance at the $0.517 mark, while the Bollinger Band average (BB: Basis) provides resistance at the $0.511 mark. The moving average (MA) and the Bollinger Band lower limit are providing support at the $0.509 and $0.504 marks. The indicators are giving a stabilizing signal and a high probability for the reverse head and shoulder formation to complete. On the other hand, the slightly bigger movement is a straight head and shoulders formation that can cause the price to dip. Traders are advised to hold while the formation plays out before making any hasty decisions.
Take Aways
- ADA price sees correction after a good rise and correction.
- The swell came with an overbuying streak could be possible pump and dump.
- ADA price stable after the correction priming for bullish momentum.
- A reverse head and shoulder brewing on the short term.
- A simple head and shoulder brewing on the slightly longer term.
- Market can sway in any direction, with the bulls currently in charge.
Disclaimer: The information provided on this page is most accurate to the best of our knowledge; however, subject to change due to various market factors. Crypto-Academy encourages our readers to learn more about market factors and risks involved before making investment decisions.