


The queen of cryptocurrency Ethereum has often been seen moving literally mimicking the king Bitcoin’s price movement, and the current weeks were no exception. The current Ethereum price analysis reveals that the occasional excepted ETH price movement, which is not rare. It is an open secret that ETH often displays small independent price movements regardless of Bitcoin price movement.
Traders often have to gain from these movements, and those relying on BTC and ETH for their daily earnings are keen to spot such differences and make profits off them.
Displaying independent movement from Bitcoin, Ethereum’s year-to-date high of $3,821 was recorded on the 5th of January, 2022. Since then, the queen of cryptocurrency has displayed better price movement than the king during the first quarter of the year; however, a steady decline is still evident as the overall market declined.
When it comes to the second quarter, the Ethereum price fell just like the Bitcoin price, recording new lows down to the $897.5 mark on the 19th of June, 2022.
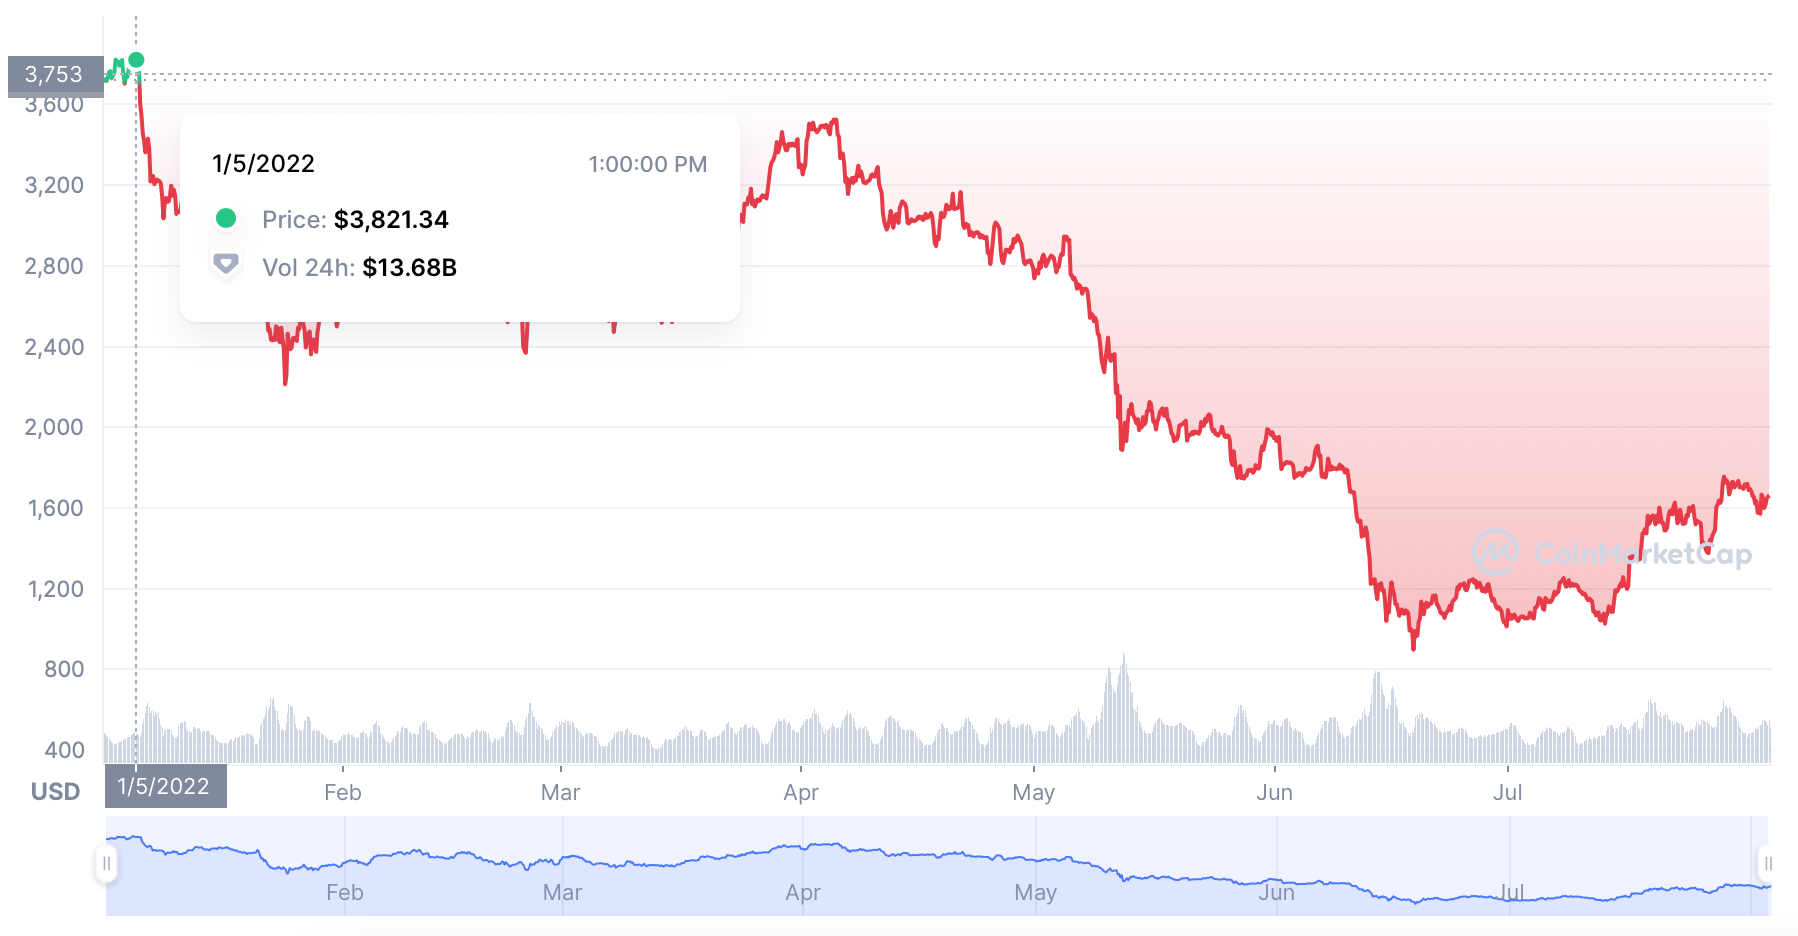
Ethereum price chart by CoinMarketCap

Ethereum being the pioneering second cryptocurrency based on the proof of stake (PoS) mechanism, enjoys the first mover advantage on many occasions, and the years 2021 and 2022 have finally displayed signs of the long-awaited independent movement sought for Ethereum.
Ethereum Price Analysis: ETH break frees of BTC movement yet again
The current Ethereum price analysis reveals that the price movement broke free of the current Bitcoin and major market movement in a surprise independent reverse head and shoulder movement breaking free of the major reverse head and shoulder that would keep the price below the $16,000 mark.
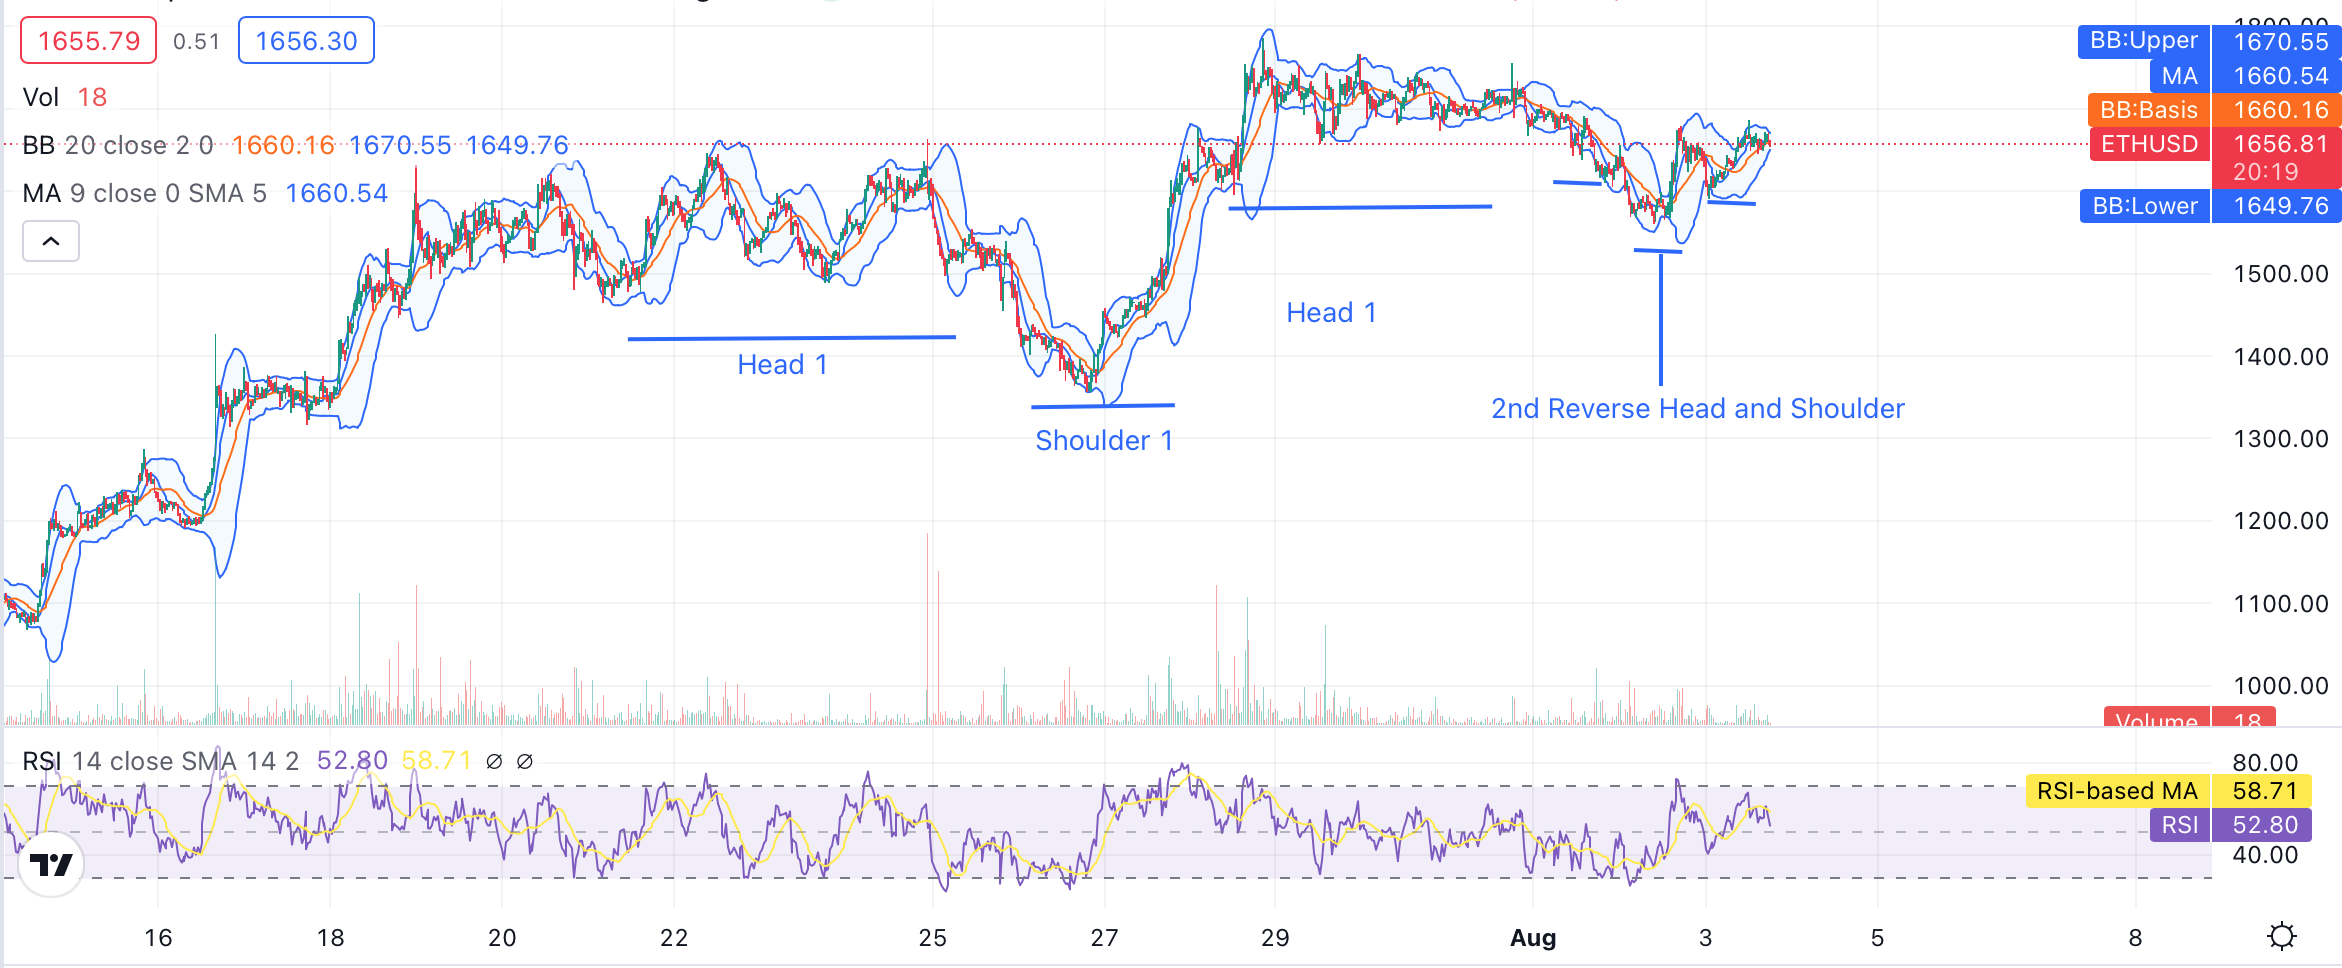
Ethereum price analysis chart made with TradingView

The first reverse head and shoulder formation commenced on the 21st of May, 2022, with the price moving within the $1,490 to $1,650 range. A flash rise in the price was observed on the 27th of May, following another $1,000 flash rise on the 28th of May. Ethereum price was since observed to be moving in a steady decline until the 2nd of August when the price movement in a retracing move fell down to the $1,570 level.
Another small reverse head and shoulder followed shortly after stabilizing the price above the $1,600 mark. At the time of writing, Ethereum’s price is moving in the $1,656 to the $1,660 range facing strong resistance.
ETH price analysis: Indicators show strong resistance
As evident from the price analysis chart above, major indicators are showing strong resistance for the queen of cryptocurrency; however, the relative strength index (RSI) shows stable price movement. The strongest resistance is present at the upper Bollinger Band mark of $1,670, while the moving average also poses resistance at the $1,660 mark. The next resistance point occurs at the Bollinger Band average found at the $1,660 mark.
Bollinger Band’s lower point serves as the current strong support for Ethereum price movement, standing at the $1,649 mark. While the RSI score of 52.80 shows stable mid-market results without the danger of an overbought or oversold zone since the RSI moving average stands at 58.71.
In the current market movement, Ethereum is likely to see a new high around the $1,700 mark within the coming two days and traders are likely to make profits.
Take Aways
- Ethereum price movement stabilizes after retrace.
- 2 back to back reverse head and shoulders break ETH price free from market movement.
- Indicators show mixed signals with strong resistance for ETH.
- RSI supports the current price movement.
- ETH is likely to hit past $1,700 mark in the week.
Disclaimer: The information provided on this page is most accurate to the best of our knowledge; however, subject to change due to various market factors. Crypto-Academy encourages our readers to learn more about market factors and risks involved before making investment decisions.