

While the king Bitcoin and queen Ethereum are enjoying a slightly better position in the down market, what was once dubbed to be the jack of cryptocurrency is in the lows. Ripple price analysis reveals that the price is likely to hit a low this week owing to a head and shoulder movement.
The second highest all-time high for Ripple XRP was recorded in September 2021, when the altcoin hit the $1.3 mark. However, following the overall market price movement, XRP price also fell down, only to recover back to the $1.23 mark briefly in November 2021. The price has been on a decline since, and the year-to-date high of $0.8971 was recorded after a reverse head and shoulder movement on the 10th of February, 2022.
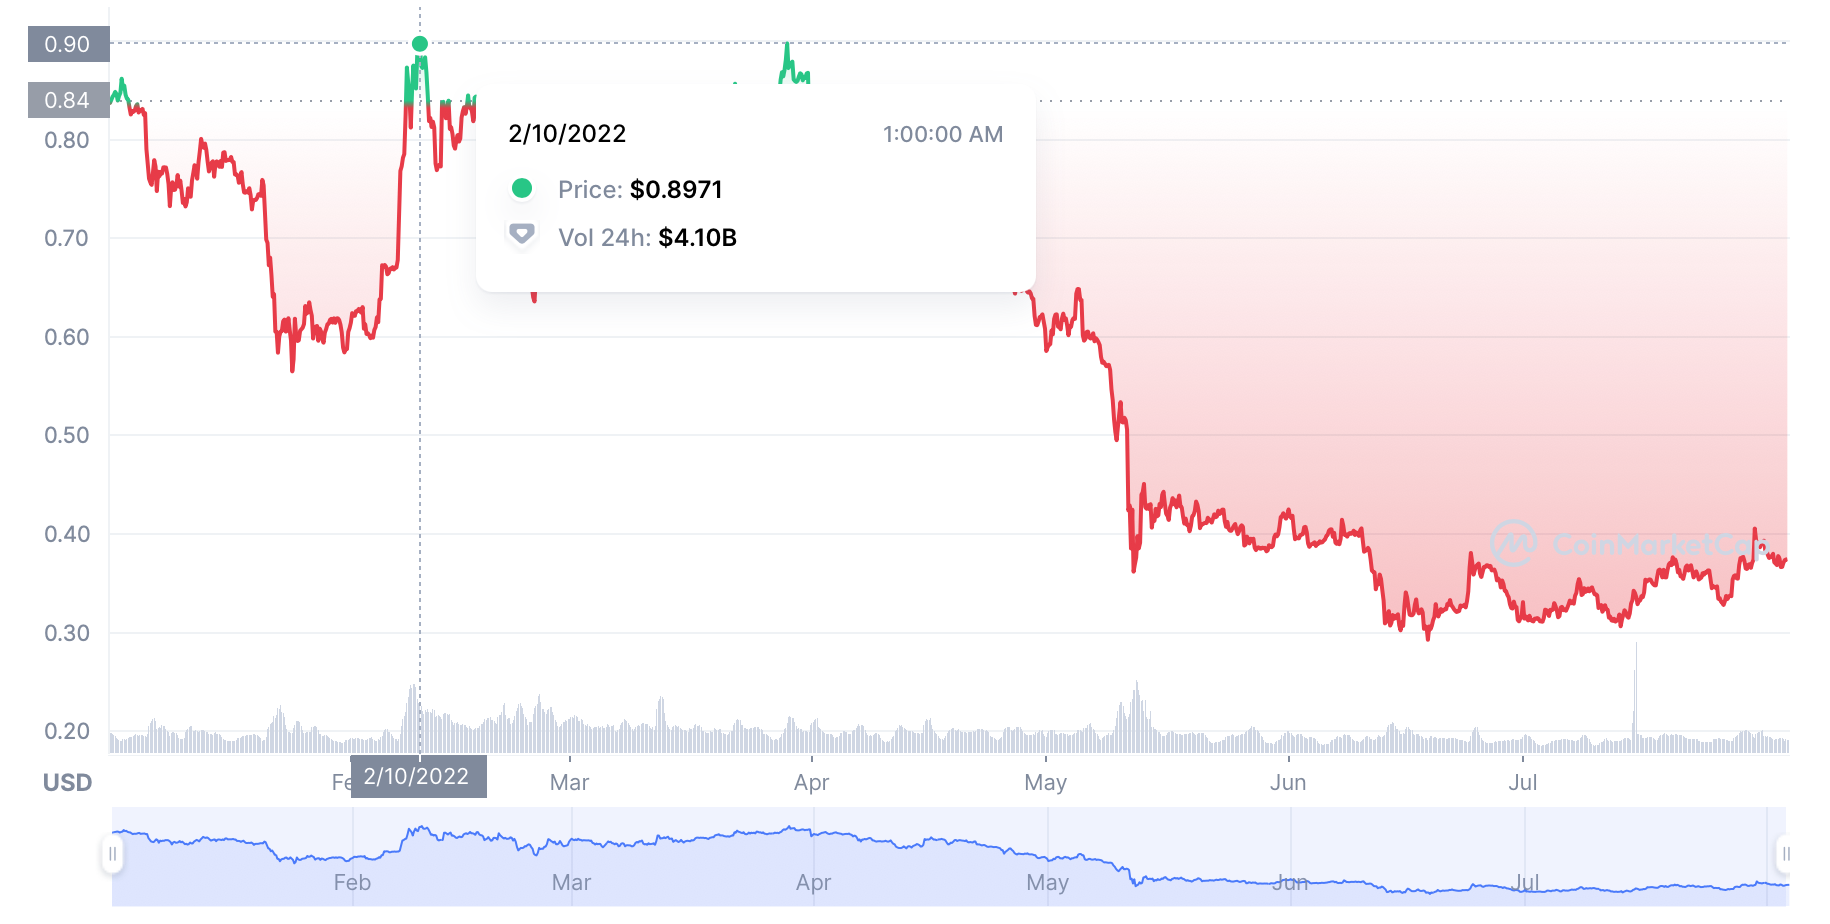
Ripple price chart by CoinMarketCap

The year-to-date low of $0.3081 was recorded on the 18th of June, 2022, which is not much lower than the current Ripple price of $0.375. Incepted as a bridge between the original cryptocurrencies and the stablecoins, Ripple is a hybrid altcoin mostly used as a remittance medium between banks in the MENA and Europe to MENA regions.
The very nature of the coin makes it dependent on not only the crypto market movement but also global inflation; however, the number of transactions made through the altcoin is directly proportional to the hike in price.
Ripple price analysis: XRP seeking support to stabilize
Ripple price analysis reveals that the altcoin somewhat followed the queen Ethereum in its price movement; however, it failed to gain similar support. Only the relative strength index (RSI) shows some sign of relief for XRP, but without the necessary support on the charts, this strength can quickly turn into a weakness.
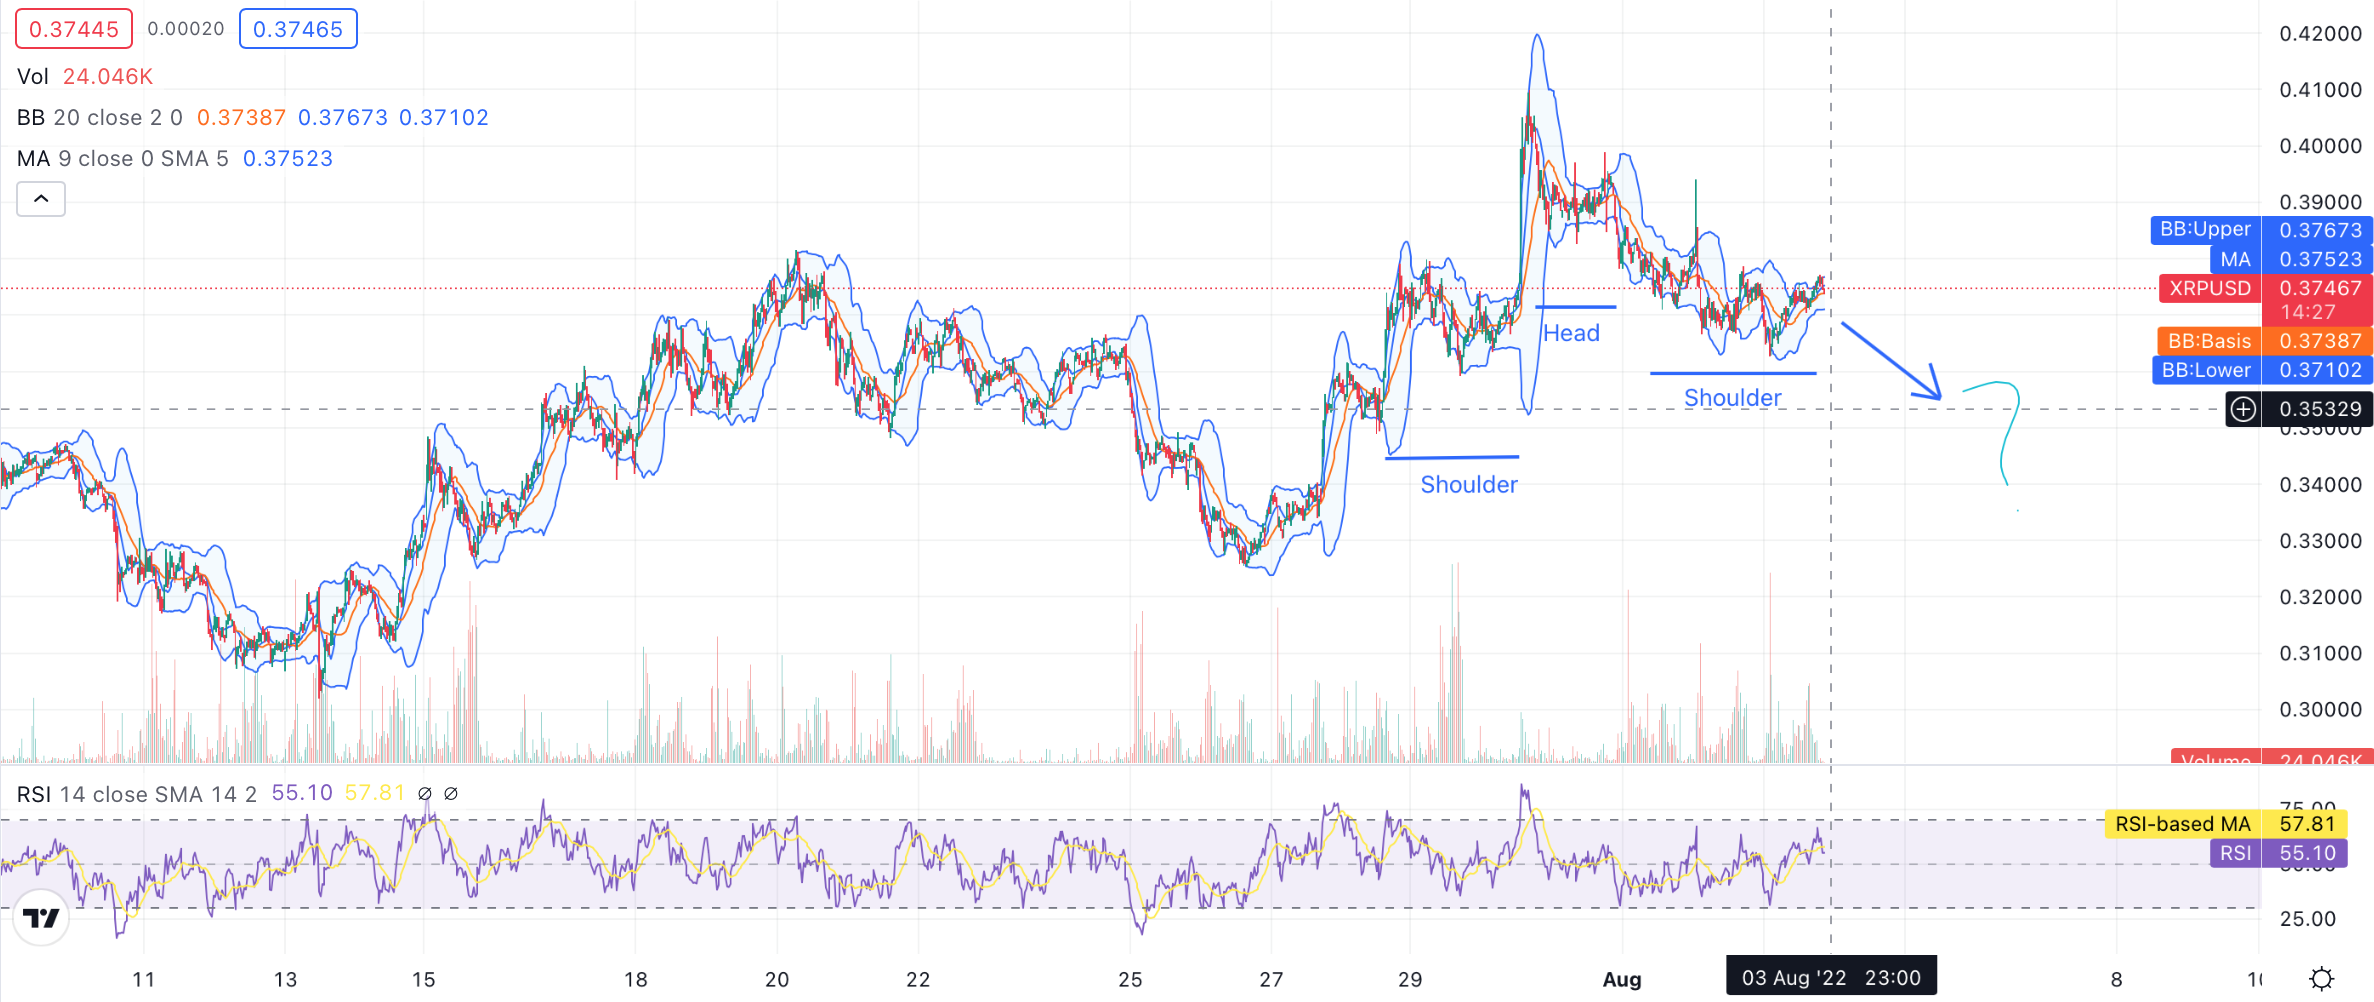
Ripple price analysis chart made with TradingView

At the time of writing, Ripple’s price stands at the $0.37467 mark, while both the moving average (MA) and upper Bollinger Band are posing strong resistance at the $0.37523 and $0.37673 marks, respectively. On the other hand, the Bollinger Band average found at $0.37387 and Bollinger Band lower mark found at $0.37102 are serving as current support points for the altcoin.
RSI score currently rests at the 55.10 mark; however, it shows a lack of strength with a 57.81 moving average. Although the indicators are giving a mixed signal, the previous market movement and the fact that XRP is largely used as a remittance medium rather than an investment asset makes it unlikely for the coin to maintain the current support levels and stay within the same price zone.
XRP price analysis: Major market shifts
With the United Kingdom hitting an inflation rate of 9.6 and the United Arab Emirates is enjoying a mere 2.5, the payment transfers from the UK to the UAE have largely been shifting in a reverse cycle. However, given the fact that the UK hosts more Arab population than the UAE hosts English, the day-to-day payment transfer shifts are not really going to help the XRP cause.
On the other hand, the fact that UAE is currently a hub for development does allow the UK and the rest of the European markets to get big enterprise-level payments. The current conditions actually give out very mixed signals for the altcoin with a likeliness of decline in the absence of investor interest.
Take Aways
- Ripple price movement breaks free from Bitcoin but not very strong.
- Ripple follows ETH in the price movement without similar support levels.
- Ripple price is likely to hit a low of $0.35 in the days to come.
- Indicators are giving mixed signals with a lack of asset investor’s interest.
- Global market indicators are also giving mixed signals not much helping XRP price movement.
Disclaimer: The information provided on this page is most accurate to the best of our knowledge; however, subject to change due to various market factors. Crypto-Academy encourages our readers to learn more about market factors and risks involved before making investment decisions.