


The king of cryptocurrency, Bitcoin, hasn’t been able to recover back to the all-time high level of $67,559 since the 8th of October 2021. The Bitcoin price analysis reveals that the king has seen a steady decline to the yearly low of $18,956 on the 12th of July 2022. Cryptocurrency traders tried to revive the coin to the glorious new heights attained in 2022 during the first quarter of the year but to no avail.
The second quarter has been devastating for Bitcoin price movement, with investors finally focusing on emerging new altcoins and tokens. Not to mention that the NFT and dApp markets have managed to shift the daily trading and newbie investors to new sectors of the cryptocurrency sphere.
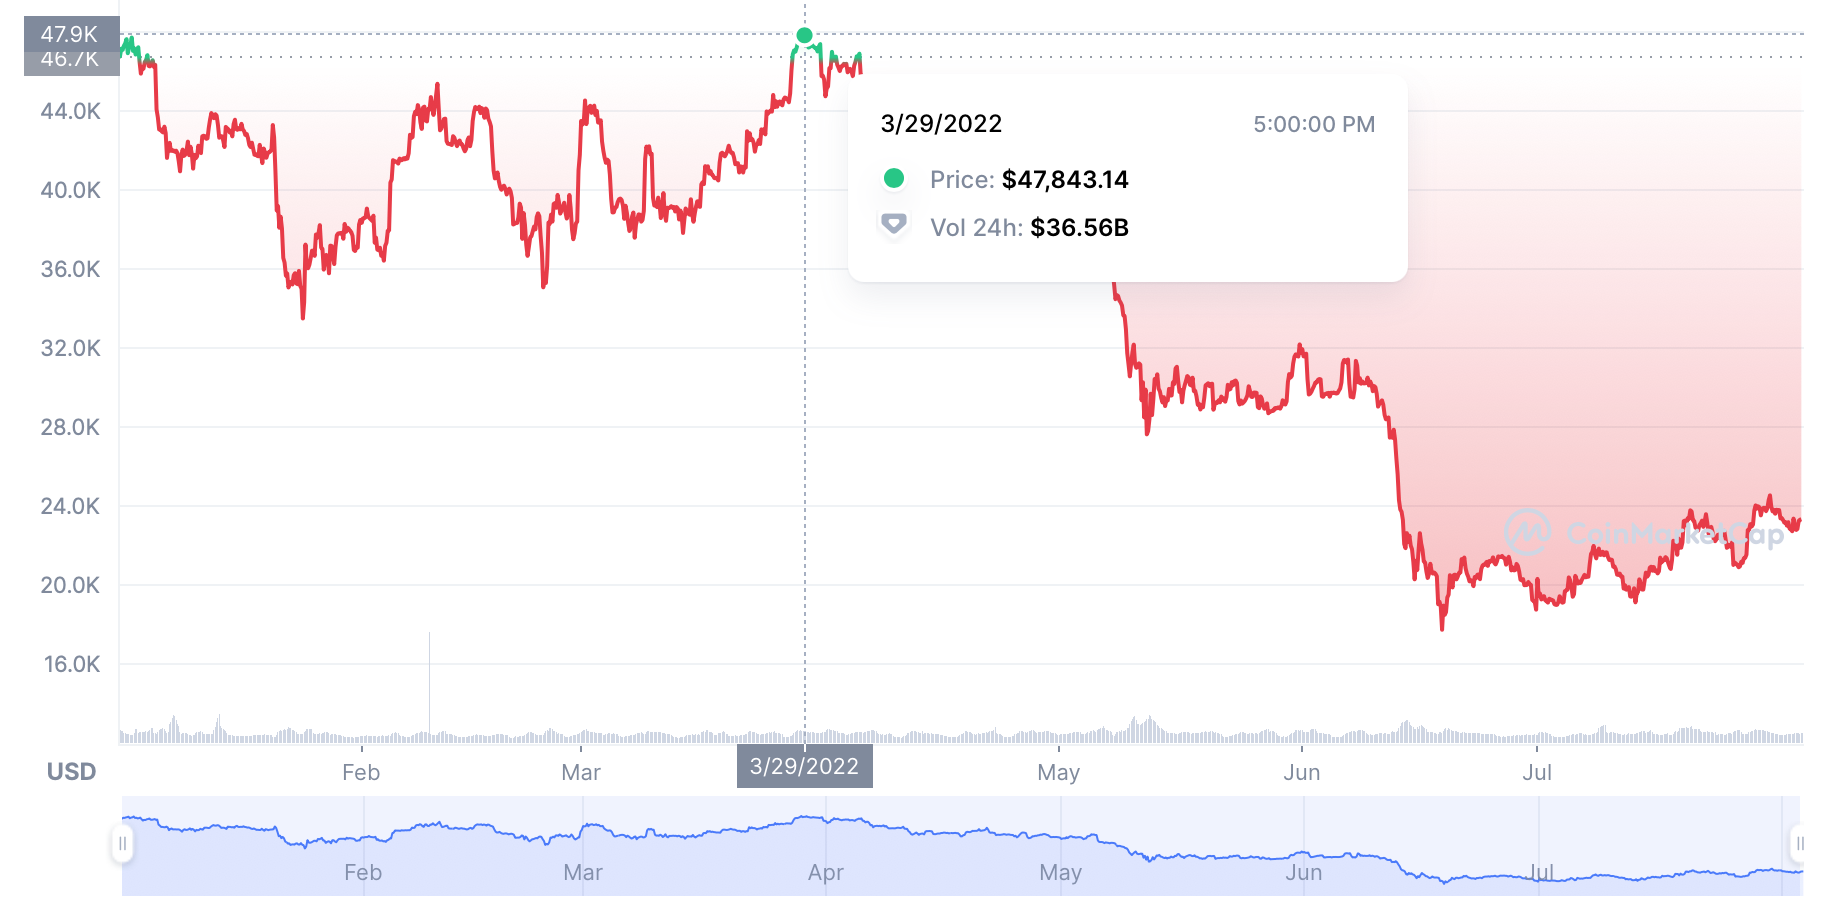
Bitcoin price analysis chart by CoinMarketCap

The year-to-date high was witnessed on the 29th of March when the king coin managed to hit the $47,834 level, however, only to see a sharp decline by the 12th of April, followed by two $10,000 drops in May and June of 2022.
Bitcoin Price Analysis reveals reverse head and shoulder
The first week of Q3, 2022, brings rather positive news for the daily traders and hodlers alike. It seems that the king is finally stabilizing and coming out of the long-standing bearish streak with a reverse head and shoulder movement. A reverse head and shoulder movement is a bullish indicator that tells of an upcoming bullish streak.

The current reverse head and shoulder movement started brewing on the 19th of July with a $1,000 flash increase in the price. Although Bitcoin wasn’t able to maintain the high, and the price dwindled until the 25th and 26th of July to hit the $20,000 range, a $1,000 flash increase was observed on the 27th of July, giving way to the current movement on the charts.
The current reverse head and shoulder movement has been brewing since the 27th of July, and it is likely that the price will remain bullish in the current week with a likely increase to the $24,520 level.
BTC price analysis: Major indicators support bulls
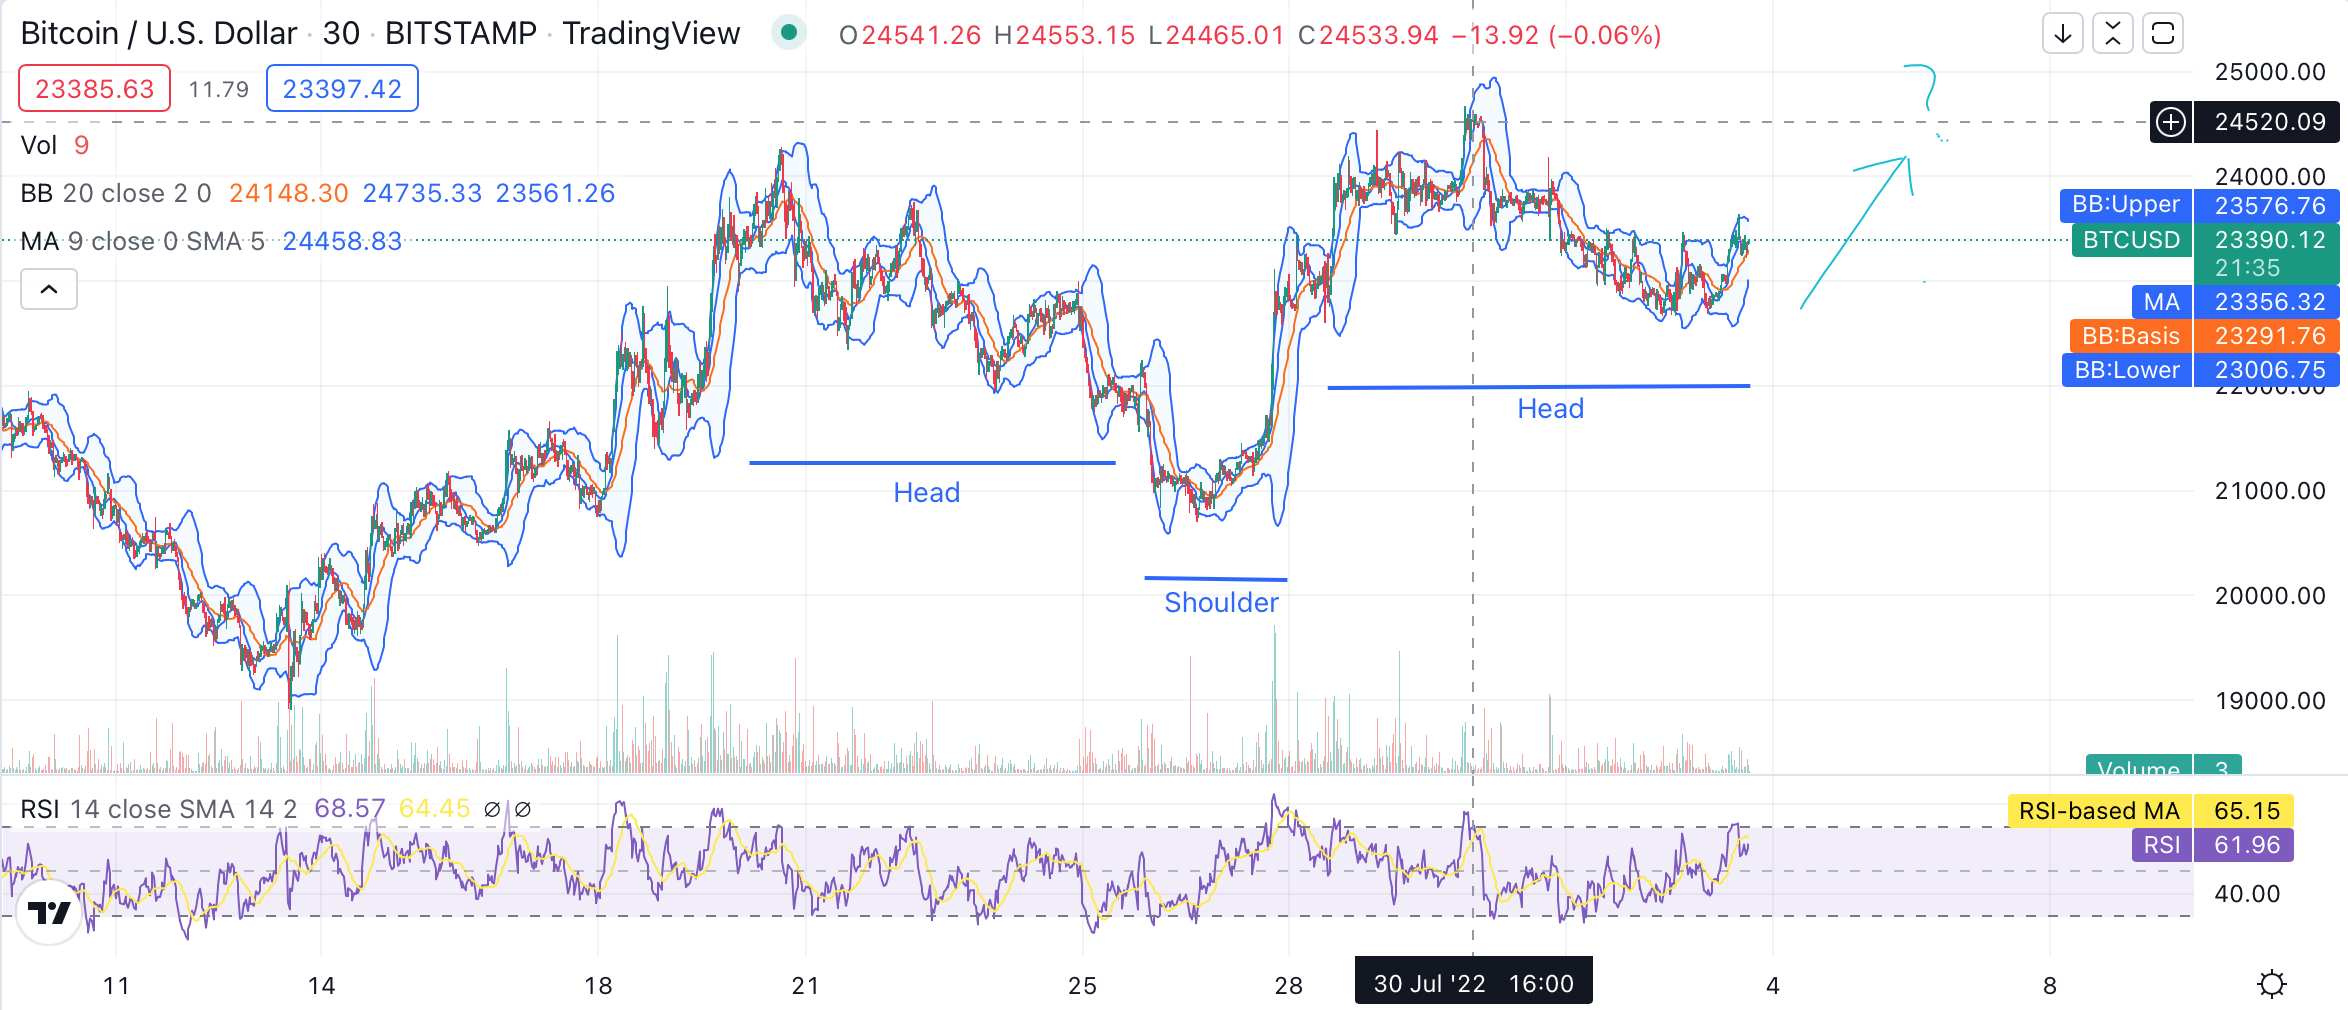
As evident from the chart above, all major indicators are supporting the brewing bullish movement, including the moving average, the relative strength index (RSI), and the Bollinger’s band. The relative strength index score stands at a good 61.96, an indication of the stable market movement. A mid-level RSI score indicates that the price is neither in the oversold nor in the overbought zones.
The immediate support is found at the moving average (MA) level of $23,356 level. The next support level is found at the Bollinger’s Band average mark of $23,291, while the lowest support level is found at the $23,006 level. On the other hand, the resistance is found at the upper Bollinger’s Band mark of $23,576. At the time of writing, the Bitcoin price is steadily hovering between the $23,390 and $23,450 levels and is likely to break the current resistance in next two days.
If the current price movement continues to brew within the current scales without any sudden market changes traders should expect steady rise in Bitcoin price.
Take Aways:
- Bitcoin price movement reveals bullish momentum.
- Current support is found at the $23,000 level.
- Current Resistance is found at the $24,576 level.
- Steady rise to $24,520 is expected during the week.
- Major indictors support the current bullish momentum.
Disclaimer: The information provided on this page is most accurate to the best of our knowledge; however, subject to change due to various market factors. Crypto-Academy encourages our readers to learn more about market factors and risks involved before making investment decisions.