
MANA Technical Analysis – December 2021
Monthly Analysis
In the last 30 days, MANA was initially bullish. The price increased by 170%, and it also reached a new all-time high at $5.90. After that, the price started declining, and the trend could be reversing in a 4-hour chart. The price has declined by around 57% so far.
Weekly Analysis
In the last 7 days, MANA had a bullish surge of around 70%, but it faced resistance at $4.23. After that, the price has started declining. A triangle pattern has taken shape, suggesting that a breakout could occur in the short run. MANA remains bearish in the 4-hour chart.
Daily Analysis
In the intraday chart, MANA has declined by around 5%. The price is currently in correction, and it may soon face resistance. The price of MANA is highly volatile at the moment due to recent market movements.
Key Structures
Support
- $3.20
Resistance
- $4.20
Indicators
Moving Average
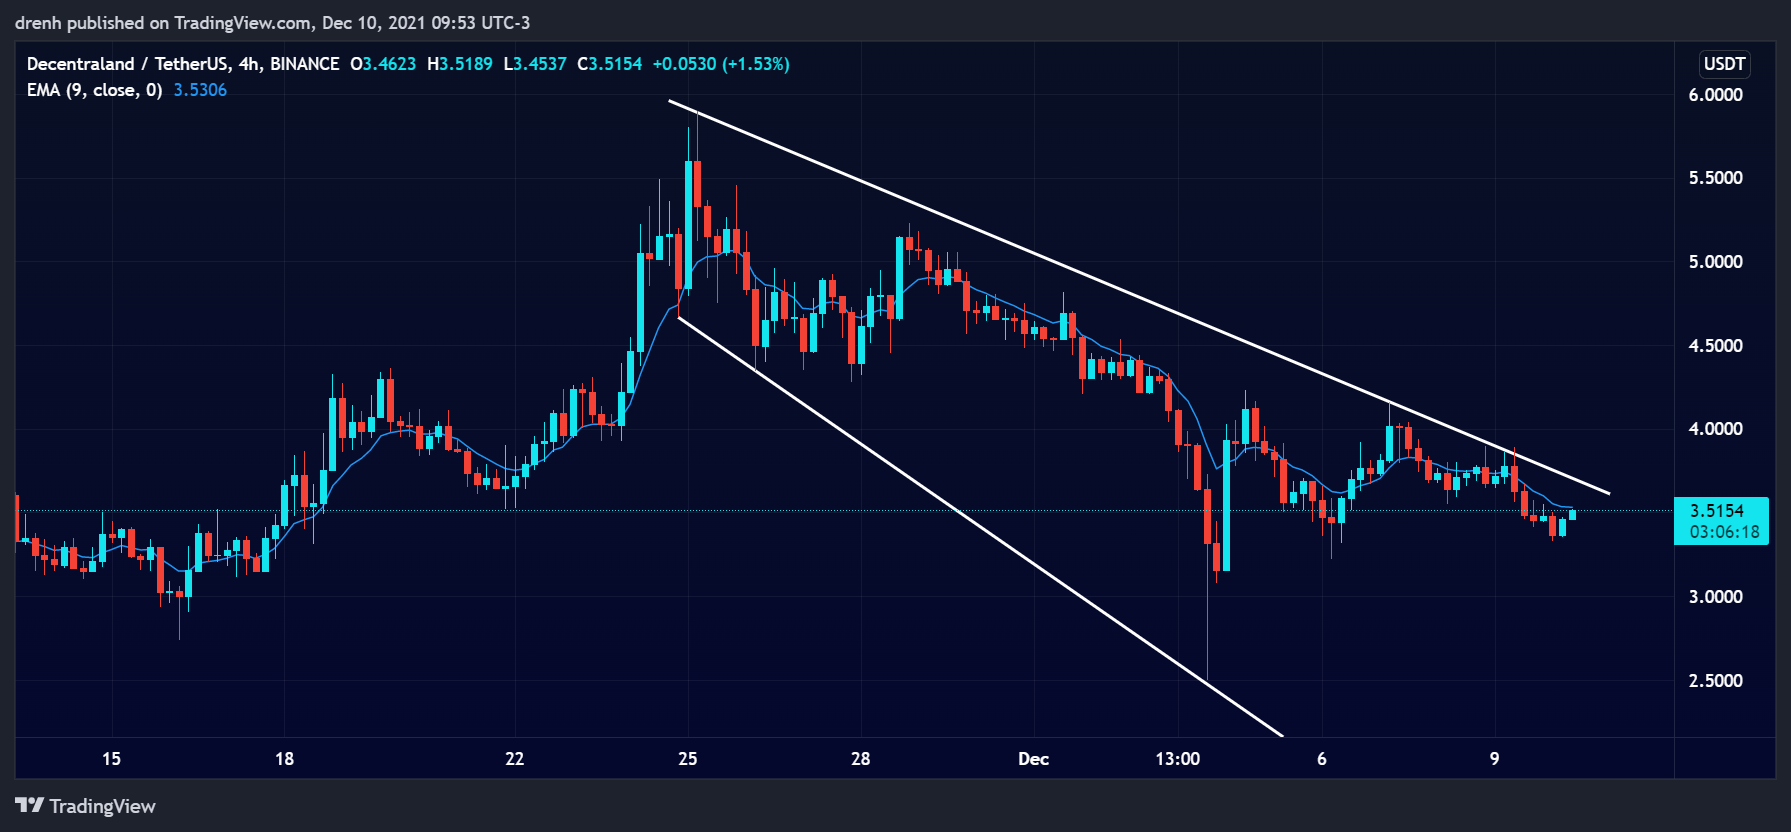
The 20-moving average of a 4-hour chart is currently above the price, indicating that the trend is currently downward for MANA and that the price could keep declining in the coming days.
The 9-EMA of a 4-hour chart is also slightly above the price despite the recent correction. This suggests that the EMA line is currently acting as resistance to the price of MANA, which remains bearish.
Relative Strength Index
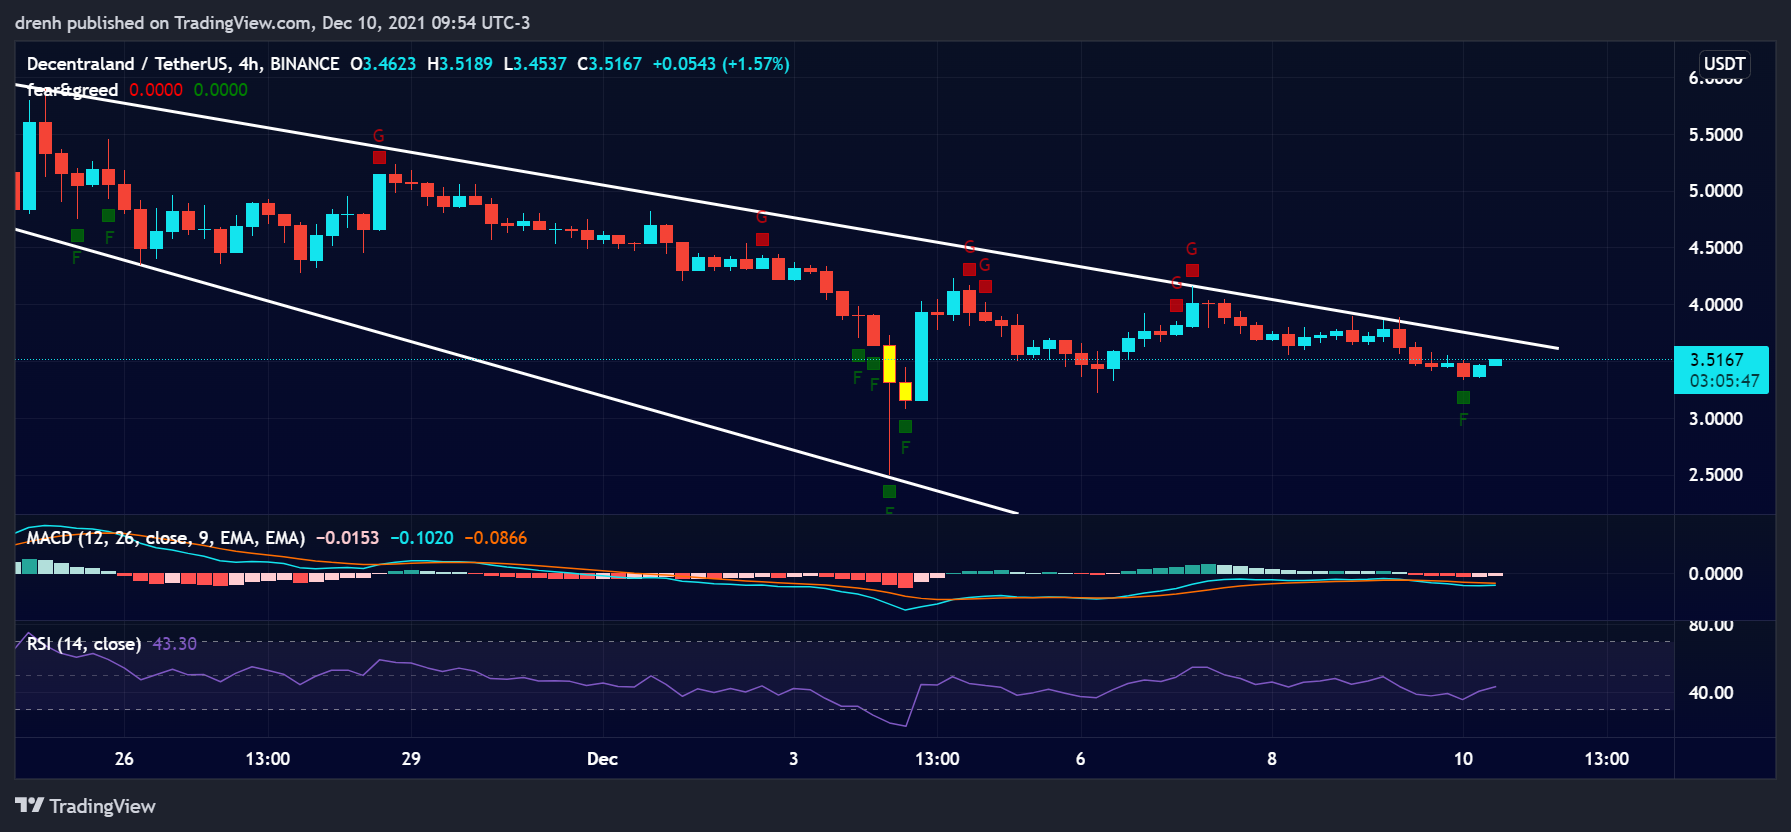
The RSI of a 4-hour chart is below 50, indicating that the selling pressure is higher for RSI. Nonetheless, the RSI has been on the rise recently, hinting at a possible reversal.
MACD
The MACD line of a 4-hour chart is currently below the signal line and below the baseline. This indicates that the momentum is bearish for MANA and that the price may keep decreasing. Nonetheless, the lines have started to converge recently, indicating that a shift in momentum may happen soon.
Fear & Greed
The fear and greed indicator of a 4-hour chart suggests that the current emotion of MANA traders is fear, suggesting that the high selling pressure could continue for Decentraland.
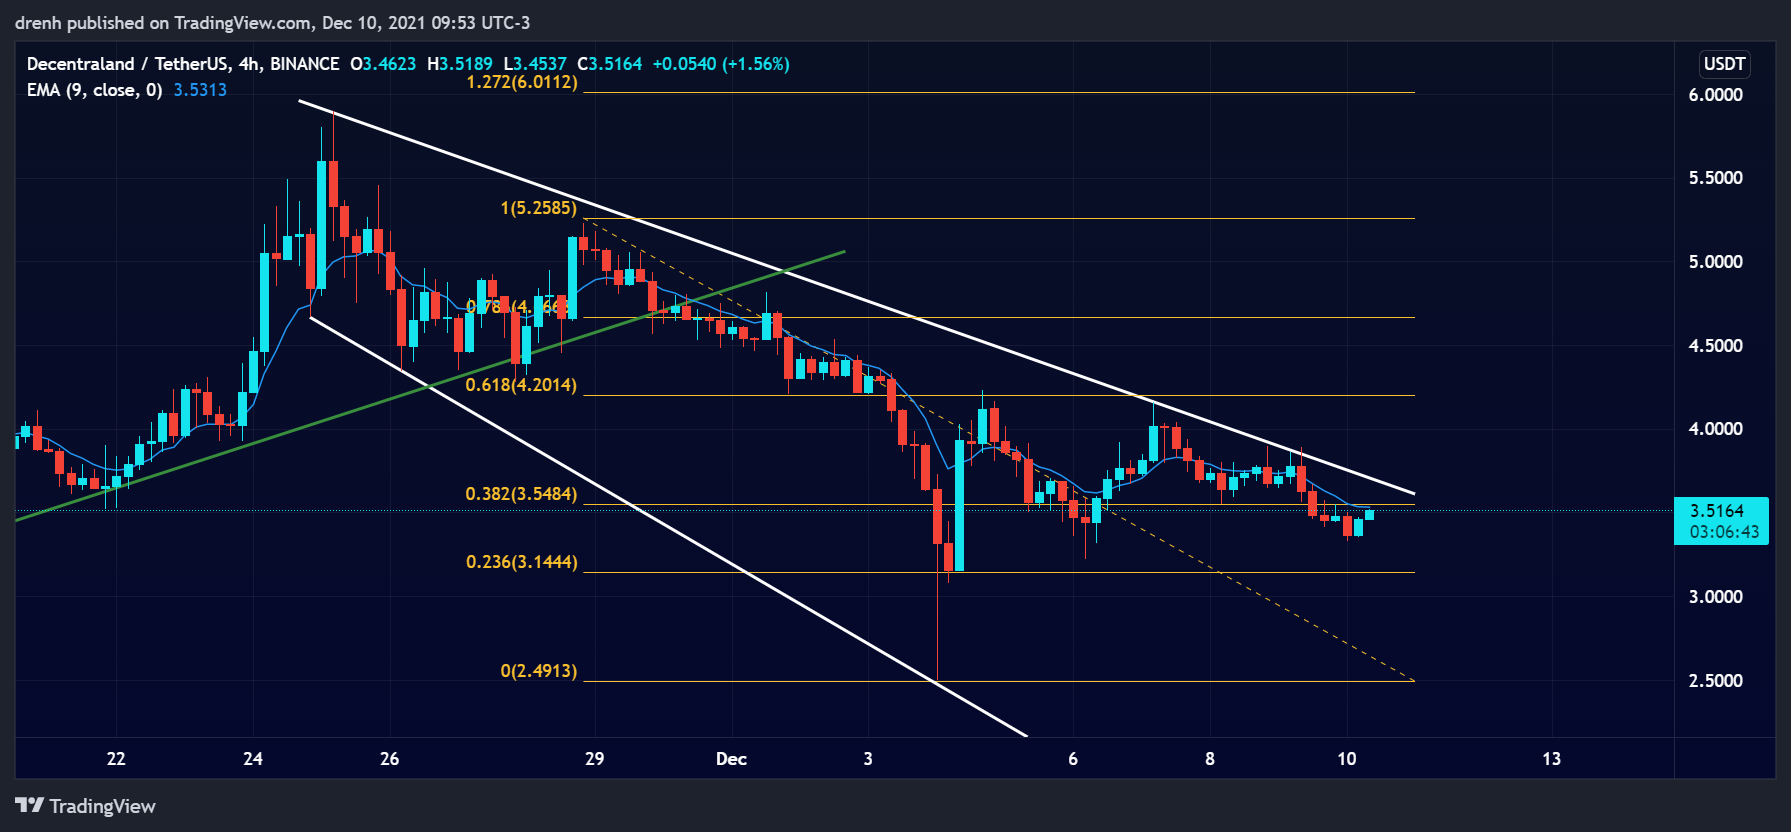
Fibonacci
The Fibonacci retracement levels of a 4-hour chart suggest that the price of MANA had retraced to the 61.8% level, suggesting that the price could keep going down in the short run. Nonetheless, the price found some support at $3.20. Nonetheless, the price could still go down to one of the extension levels.
Price Prediction MANA – December 2021
Based on this technical analysis on Decentraland (MANA), we could see its price keep declining in the short run, despite the recent correction. The price could go below $2 if it does not find support at our projected structure. As for the longer run, MANA is still bullish, and its fundamentals suggest that it could reach a new all-time high if this bull cycle has another round.
Latest News for MANA – Affecting Price
Recently, it was announced that a project named Millionaire Mansion is going to be launched on Decentraland, and it may include VIPs in the Decentraland metaverse. This could hugely impact the price of MANA in the coming weeks.
Also read:
Decentraland Price Prediction 2021 and Beyond – Is MANA a Good Investment?
Cryptocurrency and Metaverse – What is the Connection Between Cryptocurrencies and Metaverse?
These are the Top 5 Metaverse Coins to Buy Right Now
Best Cryptocurrencies to Buy Right Now – 4 Trending Cryptocurrencies to Watch
 Surges Post-Bitcoin Halving")

