CRO Technical Analysis – October 2021
Monthly Analysis
Over the last 30 days, CRO initially declined by around 28%, making CRO bearish. Nonetheless, CRO found support at $0.14, and it started increasing once again. The price increased by 37%, reversing the trend and making CRO traders bullish once again. The price has slightly dipped recently by around 10% and is now heading upwards once again.
Weekly Analysis
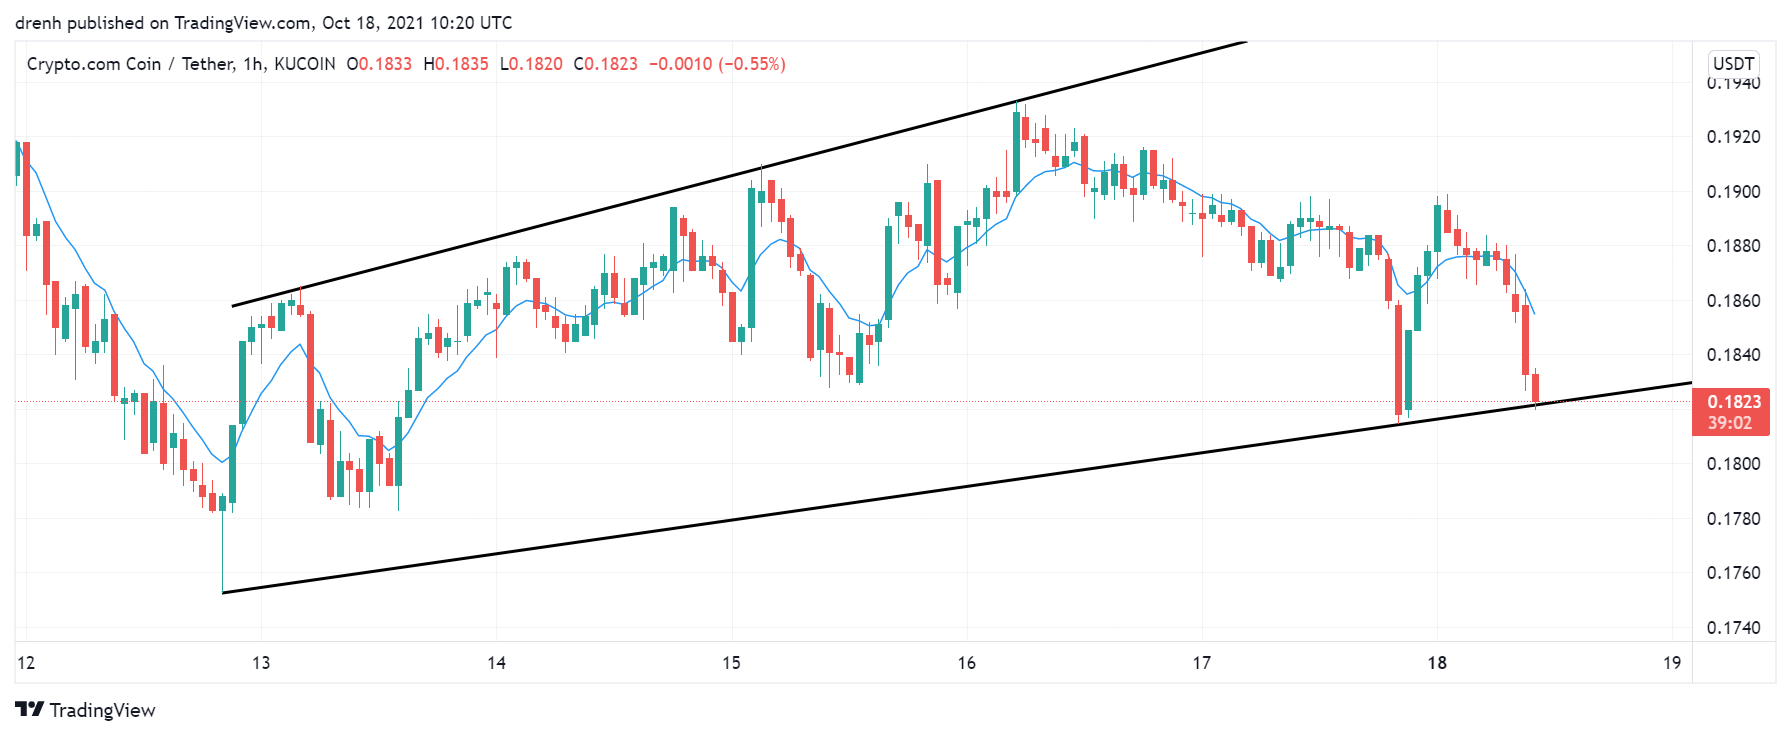
In a 1-hour chart, CRO has been bullish. The trend is upward with a broadening wedge pattern taking shape. However, recent lows have been lower and could indicate that the sling pressure is increasing.

Daily Analysis
In the intraday chart, CRO has been bearish, where a descending broadening wedge has taken shape. This indicates that the price could keep decreasing in the following hours as the price has declined by 4% so far.
Key Structures
Support
- $0.17
Resistance
- $0.195
Indicators
Moving Average
The 20-day moving average is below the price and is currently acting as support for CRO. If the price finds support at the MA line, then the price of CRO could keep increasing in the coming days.
The 9-day EMA has recently climbed above the price due to the recent price decline. This could indicate that the trend is reversing and that the price of CRO could decline.
Relative Strength Index
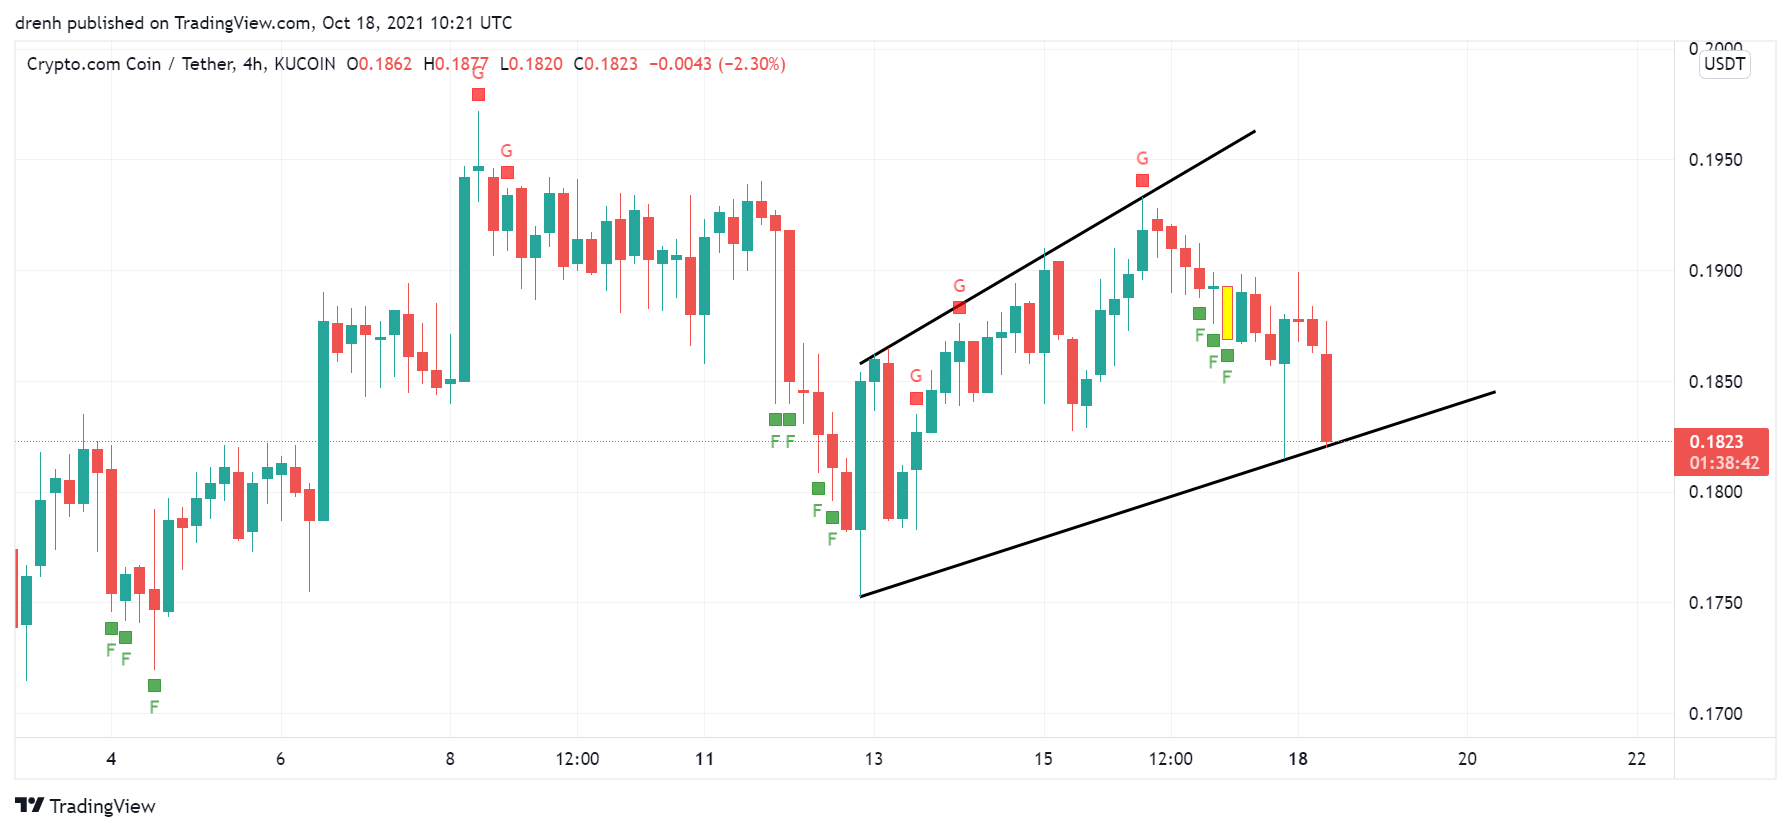
The RSI of a daily chart is above 50, meaning that the buying pressure is still higher, but it has been declining recently, indicating that the momentum is shifting. In a 4-hour chart, the RSI is even more bearish.
MACD
The MACD line has recently intersected with the signal line, meaning that the momentum is shifting in a daily chart and that CRO is becoming bearish. In a 4-hour chart, the MACD line is already below the signal line and below the baseline, indicating that the price of CRO could keep decreasing in the coming hours/days.
Fear & Greed
The fear and greed indicator suggests that the current emotion of CRO traders is fear. However, excessive fear is sometimes the best time to buy and reverse the trend.

Fibonacci
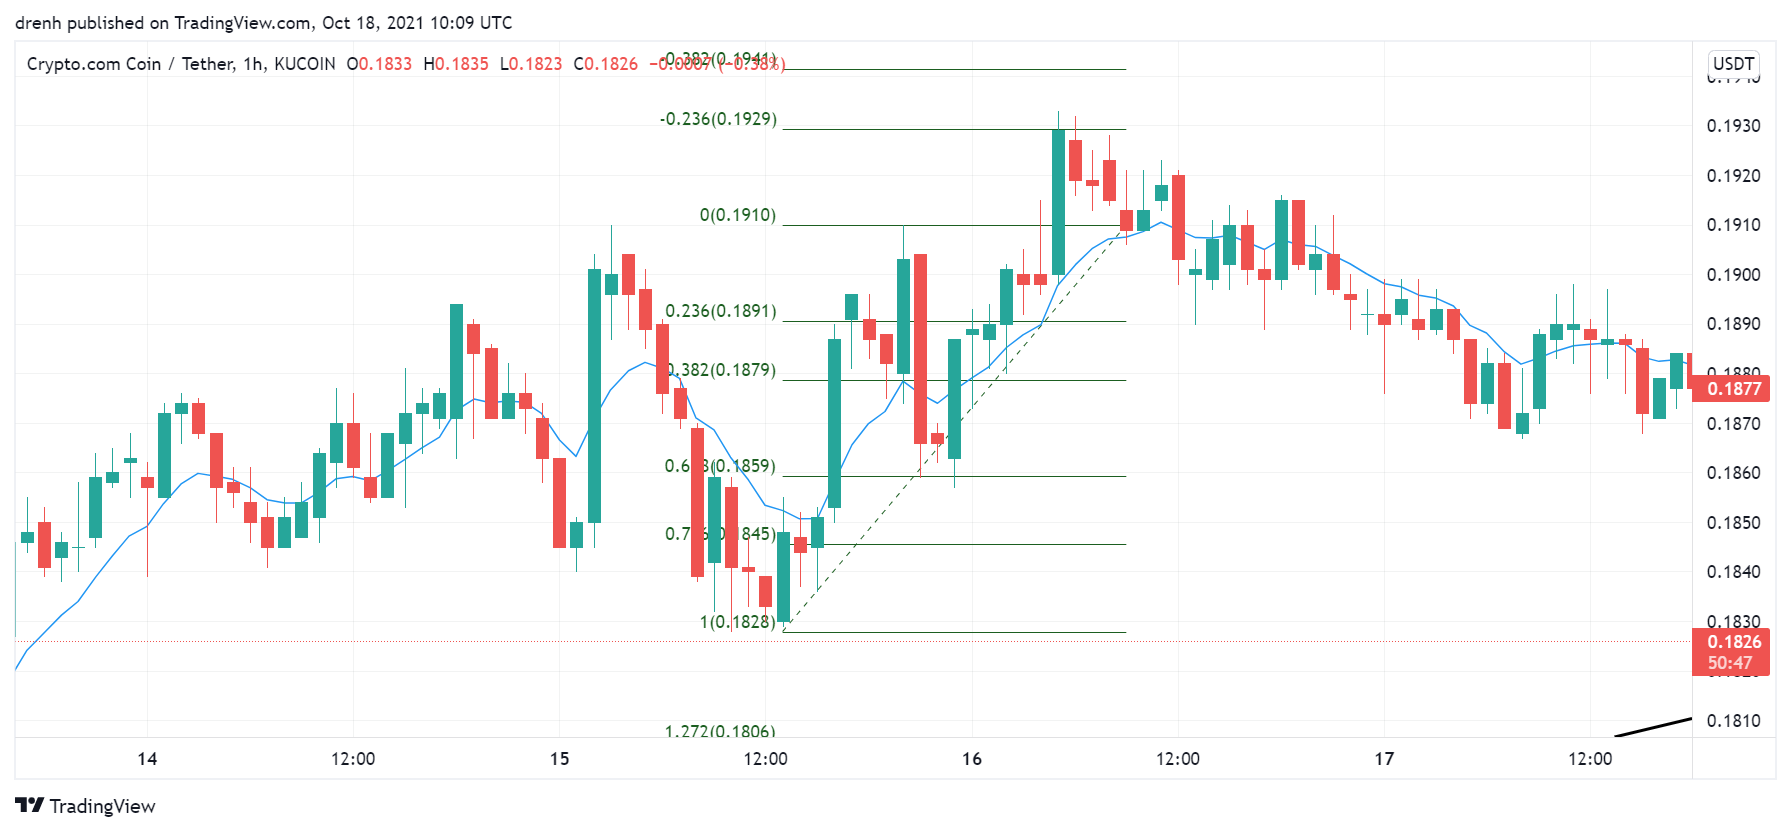
The Fibonacci retracement level suggests that the price of CRO has recently respected the levels, as the price has retraced to the 61.8% and then moved to the extension level.

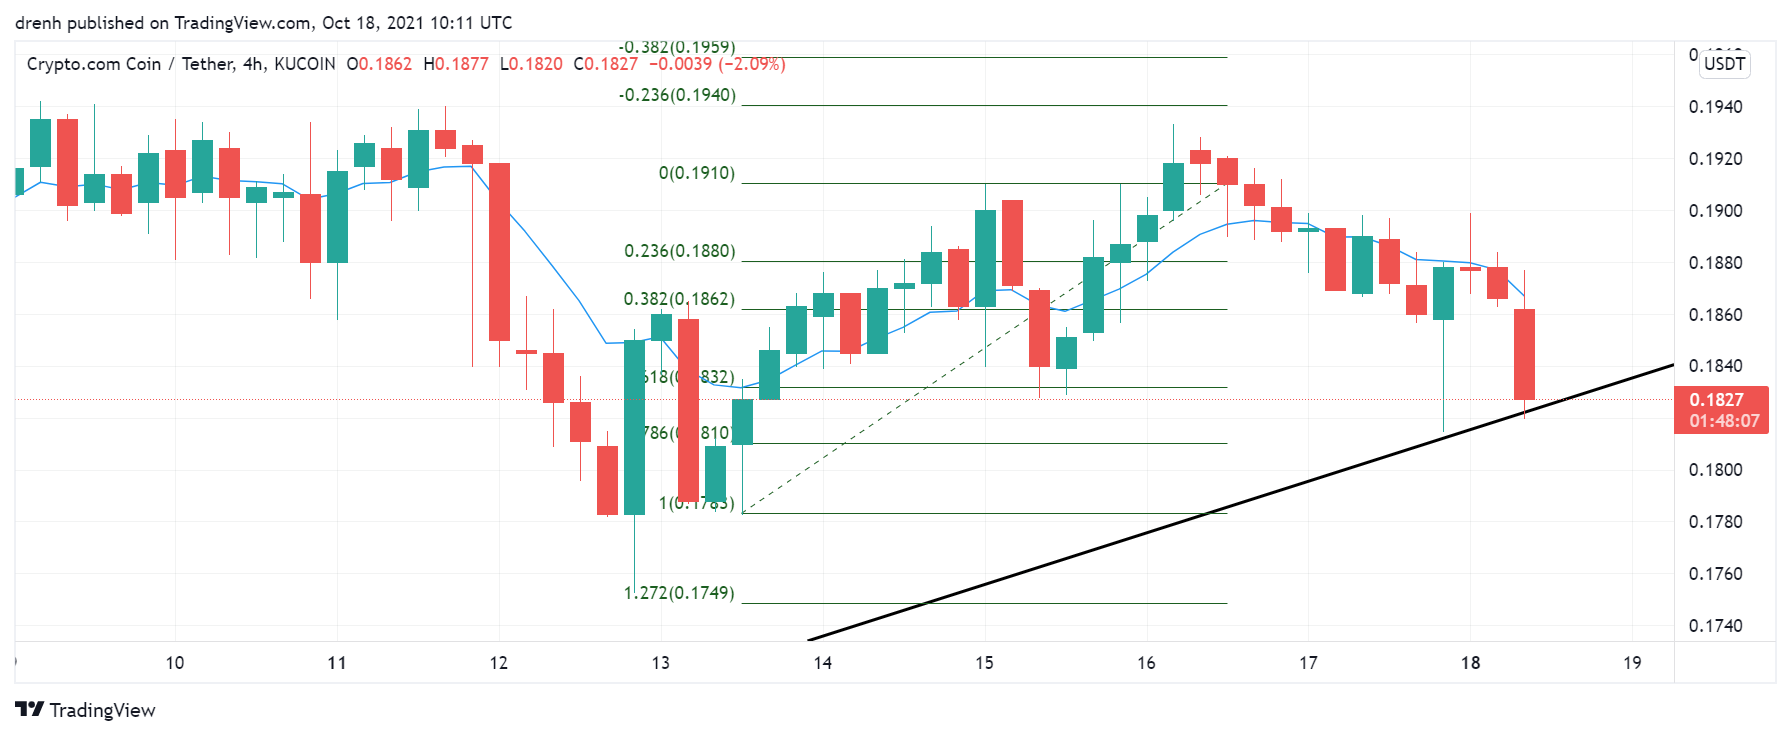
Similar to that pattern, Fibonacci was respected in a 4-hour chart, where the price found support at 61.8%, but it failed to reach the 23.6% extension level. The price has been declining recently, so CRO has to find support before assessing Fibonacci levels.

Price Prediction CRO – October 2021
Based on this technical analysis on Crypto.com Coin (CRO), its price could decline to $0.17 in the coming hours due to the high selling pressure. Nonetheless, the longer-term trend for CRO is still bullish, so CRO could increase in the remaining weeks of this quarter. Furthermore, if BTC increases at the rate that experts project, then CRO could easily go up to $1.
Latest News for CRO – Affecting Price
Crypto.com has recently become a node validator on the Orion protocol. This could help Crypto.com expand as a network and have more dominance in the market, which then affects its price positively.
Also read: Crypto.com Coin Price Prediction 2021 and Beyond – Is CRO a Good Investment?


