
AKITA Technical Analysis – December 2021
Monthly Analysis
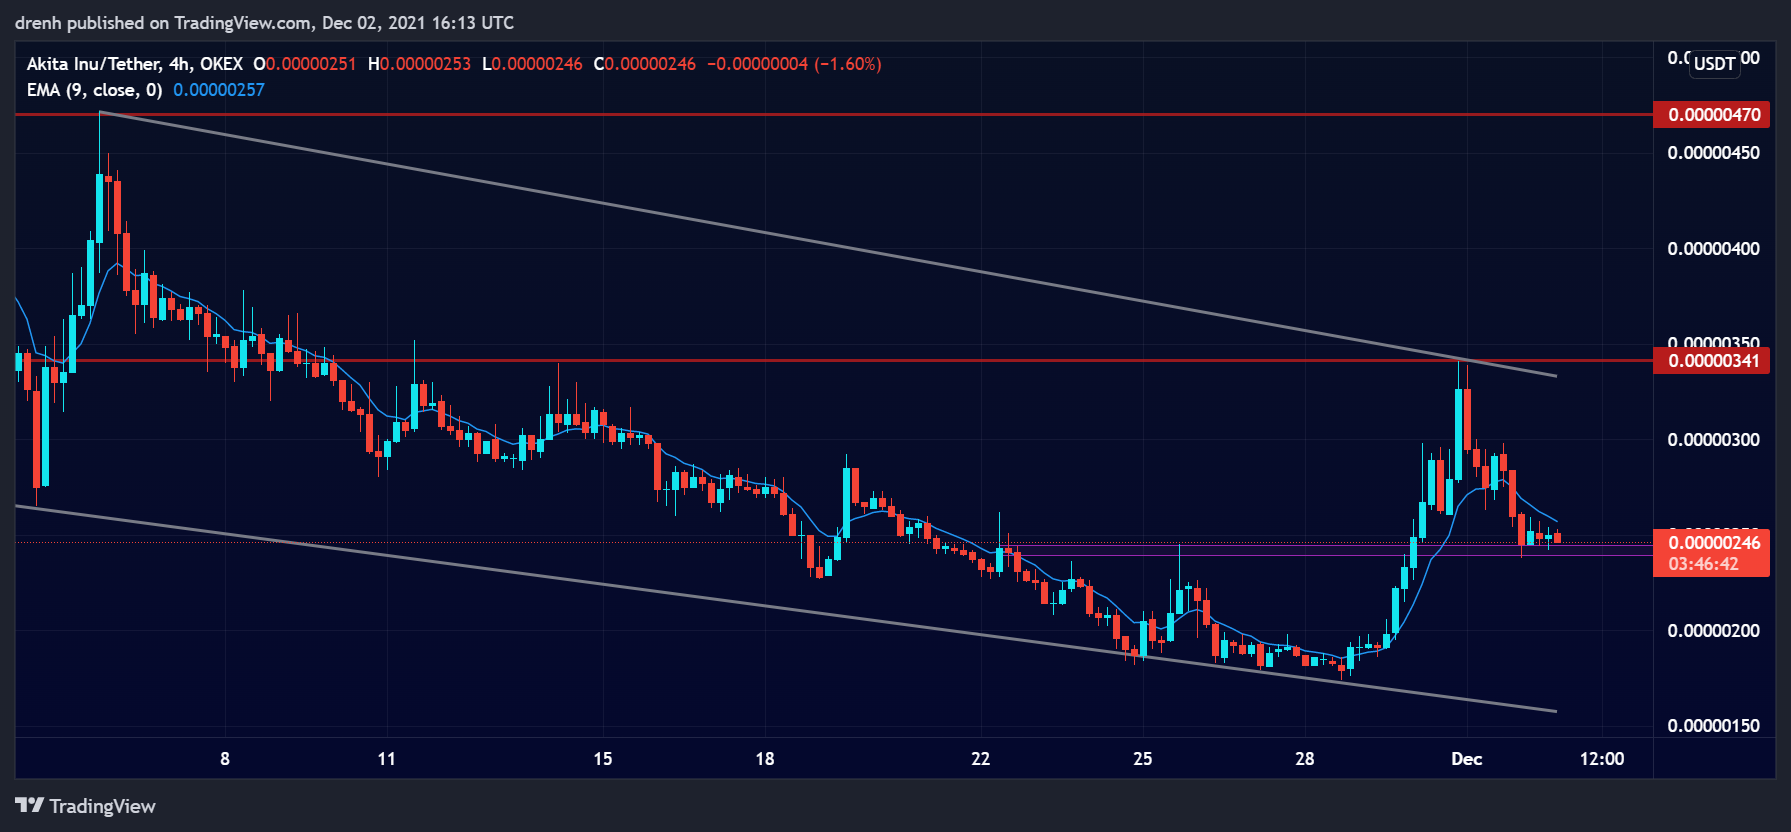
Throughout November, AKITA was mainly bearish. The price declined by around 67% in recent weeks, noting a downtrend for Akita Inu. Nonetheless, after the price found support at $0.0000017, AKITA had a bullish breakout of 96%, breaking the upper line of the trend and hinting at a possible reversal. The price is currently retracing again.
Weekly Analysis
In the last 7 days, buyers took over for AKITA. The price increased by 96% in just a few days, and then it was stopped at resistance at $0.0000034. The price has now retraced by around 30%. It could find support at the level it is currently at.
Daily Analysis
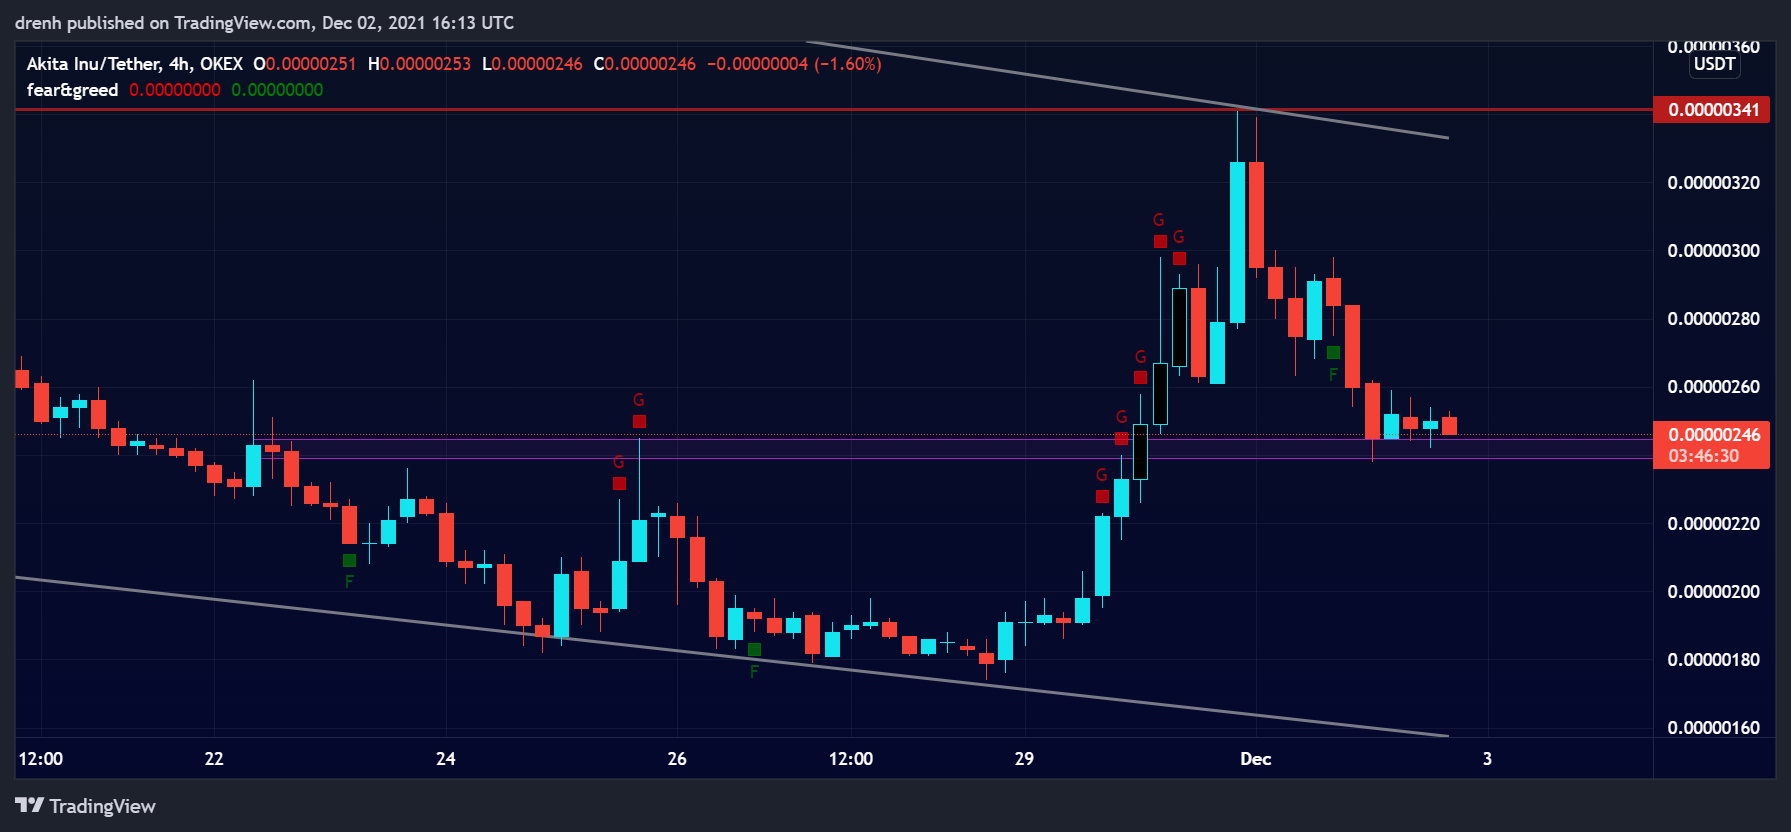
In the intraday chart, AKITA has been highly volatile. The price has been fluctuating by a range of 5-8% throughout the day. We could see AKITA find support in the coming hours and then surge upward.
Key Structures
Support
- $0.0000017
Resistance
- $0.0000034
Indicators
Moving Average
The 20-moving average of a 4-hour chart is above the price, indicating that the trend could as well be downward despite the recent bullish surge. This could see the price of AKITA decline in the coming days.
The 9-EMA of a 4-hour chart is also above the price due to the recent retracement. The EMA line could act as resistance to the price of AKITA if it attempts to increase in the short run.
Relative Strength Index
The RSI of a 4-hour chart was above 70 from the recent high, meaning that AKITA became overbought. This led to the recent retracement. The RSI currently is at around 50, meaning that AKITA now has the room to keep growing.
MACD
The MACD line is currently below the signal line, meaning that the momentum of a 4-hour chart is bearish and that the price of AKITA could decline in the short run.
Fear & Greed
The fear and greed indicator of a 4-hour chart suggests that the current emotion of AKITA traders is fear due to the recent 30% retracement of the price.
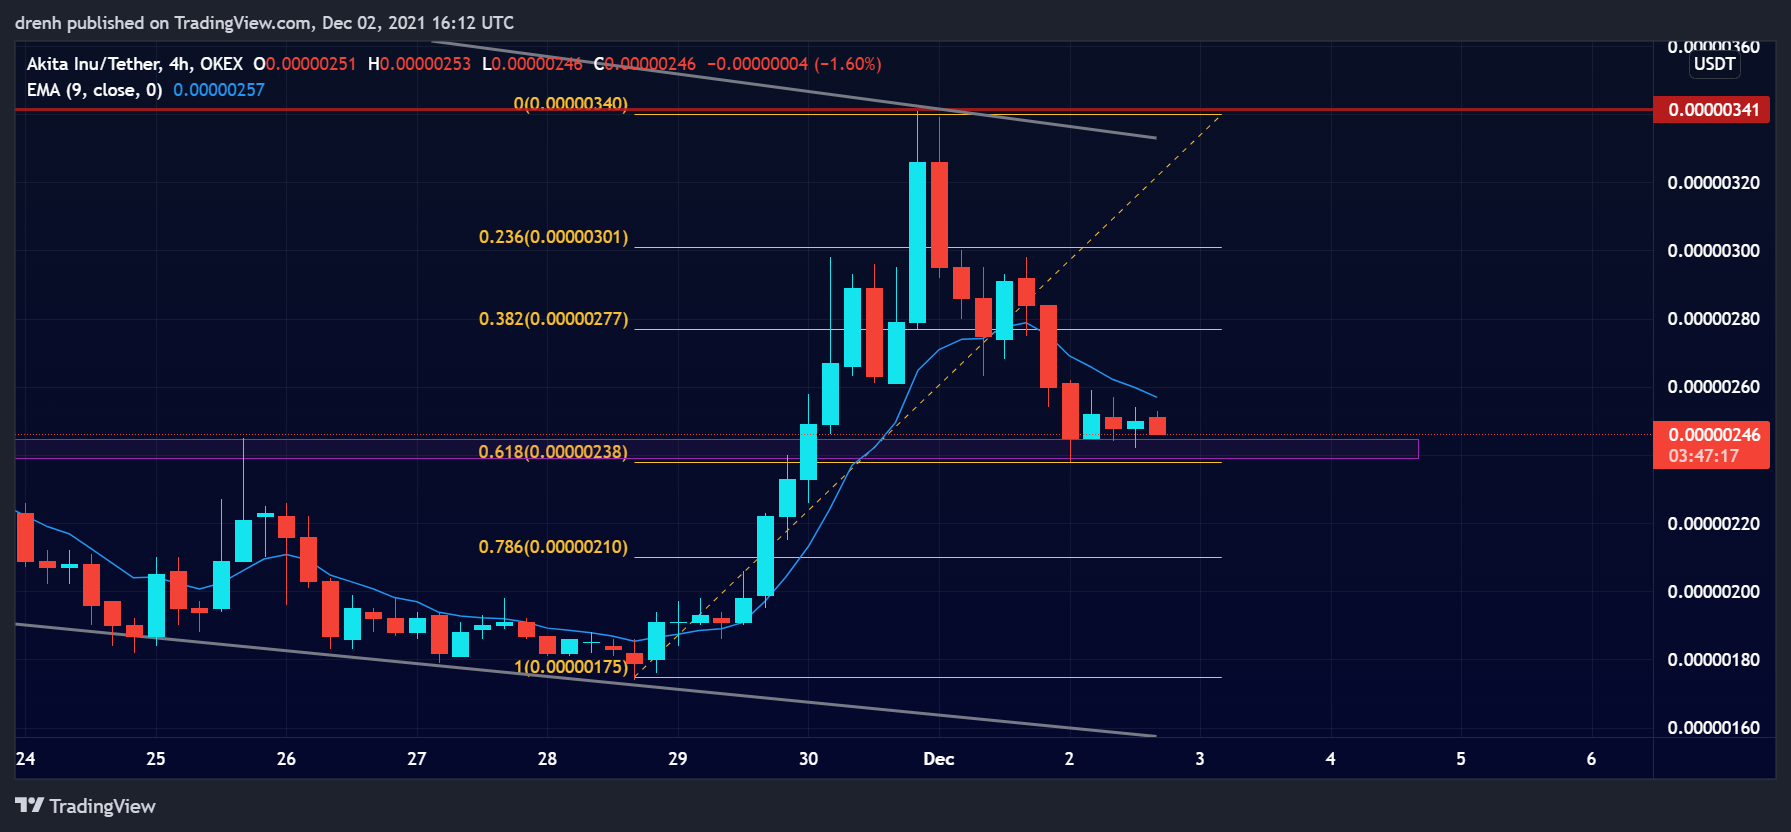
Fibonacci
The Fibonacci retracement levels suggest that the price is currently being supported at the 61.8% level. If this structure is strong, then AKITA could easily surge upward and move to one of the extension levels in the short run.
Price Prediction AKITA – December 2021
Based on this technical analysis on AKITA, we could see its price have another big surge upwards in the short run, which would see AKITA reach around $0.000004. If the price does not find support at its current position, then the price could go back to $0.0000017 once again. As for the rest of December, we could see AKITA reach a new all-time high. A price of $0.00001 could be reached in this cycle.
Latest News for AKITA – Affecting Price
The hype for meme-influenced coins is still going, and it may only intensify. Dogecoin has recently had another surge in the intraday chart due to Elon Musk’s social media activity. This can have a good effect on the price of Akita Inu.
Also read: Akita Inu (AKITA) Price Prediction 2021 and Beyond – Is AKITA a Good Investment?
 Surges Post-Bitcoin Halving")

