
DOT Technical Analysis – November 2021
Monthly Analysis
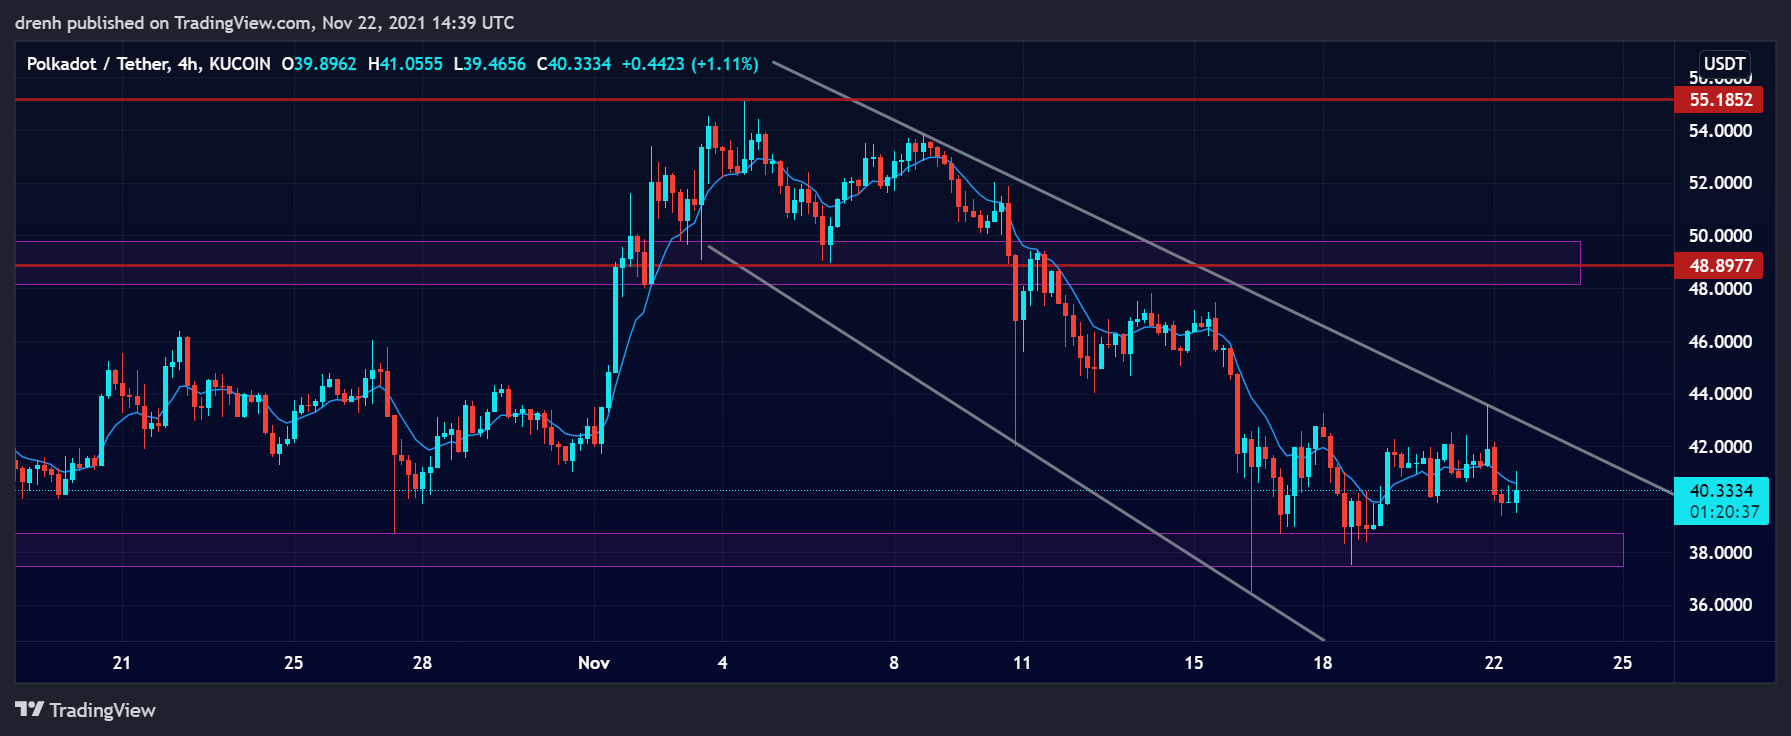
In the last 30 days, DOT initially increased by around 42%. This made DOT reach a new all-time high at $55.After failing to beat that resistance close to the all-time high, the price started declining. DOT dipped by around 33% and found resistance at around $36. The price is currently in consolidation.
Weekly Analysis
In the last 7 days, the price of DOT has been in consolidation. The price decreased by 13% initially, but it then increased by around 16%. The trend is in a downtrend and the price could keep declining in the coming days.
Daily Analysis
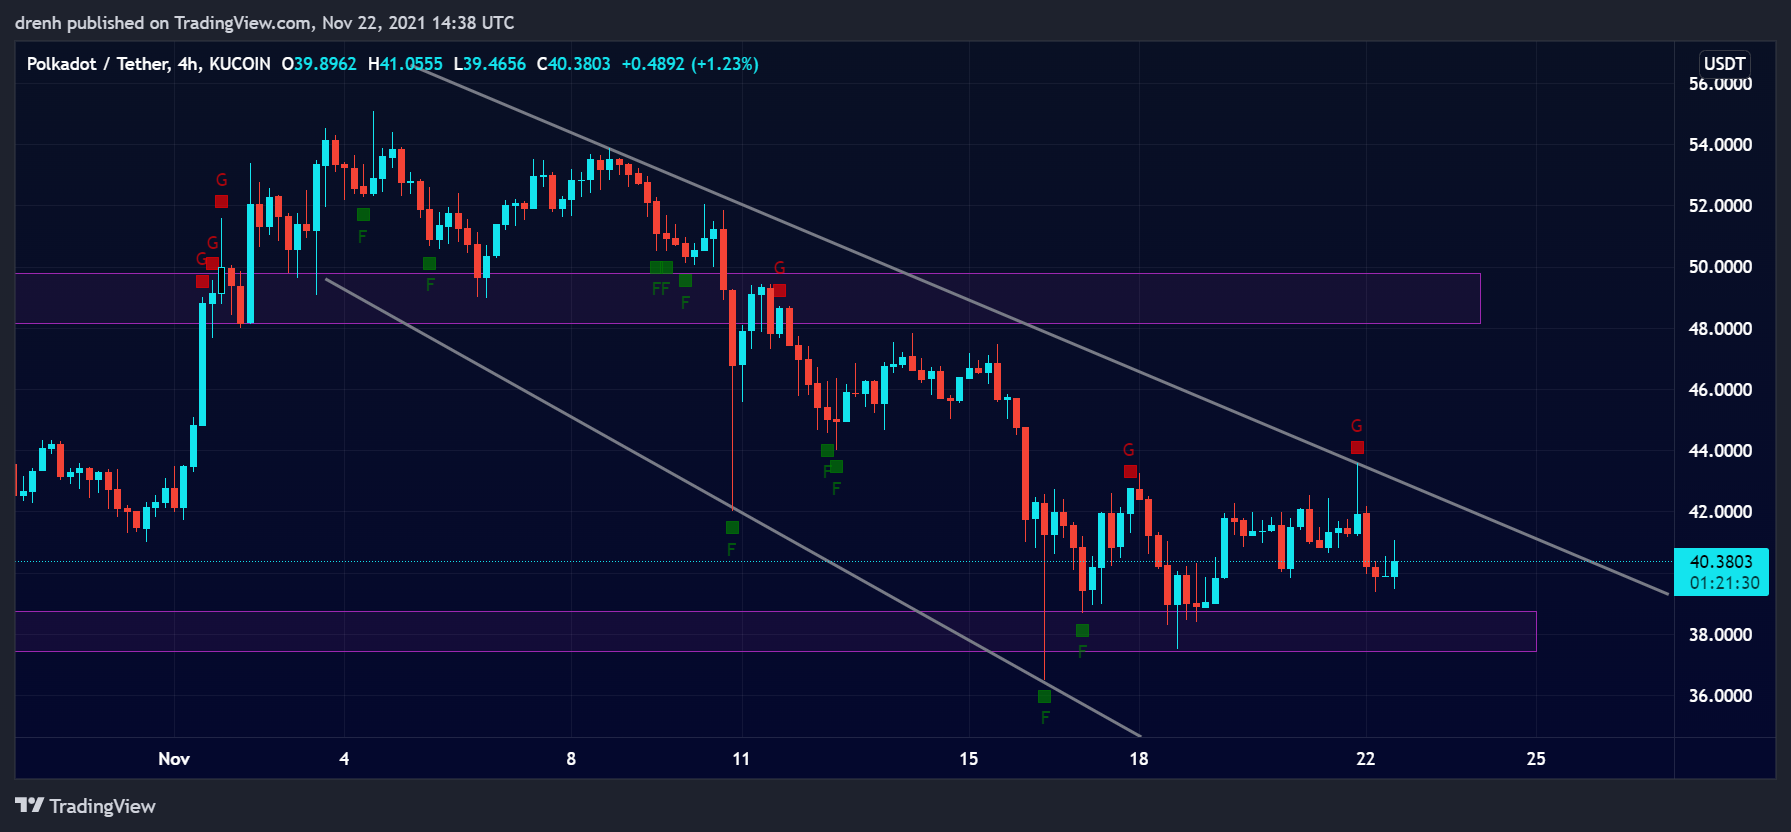
In the intraday chart, the price of DOT has been bearish and declined by around 6%. After that, the price had a bullish breakout of 4%, indicating a trend reversal in the short run.
Key Structures
Support
- $36
Resistance
- $43
Indicators
Moving Average
The 20-moving average of a 4-hour chart is above the price, indicating that the trend is downward and that the price of DOT could keep declining in the coming days.
The 9-EMA of a 4-hour chart is also currently above the price and currently acting as resistance to the price of DOT, indicating that the price could decline in the short run.
Relative Strength Index
The RSI of a 4-hour is now fairly average and at around 50. This indicates that there is room for both growth and reduction in the price of DOT.
MACD
The MACD line of a 4-hour was recently above the signal, but due to convergence, it has now moved below the signal line. Because of this, we could expect bearish momentum and the price of DOT to keep declining.
Fear & Greed
The fear and greed indicator of a 4-hour chart indicates that the current emotion of DOT traders is greed due to the recent impulsive waves upward. Another factor contributing to greed is the strong buying pressure at the support structures.
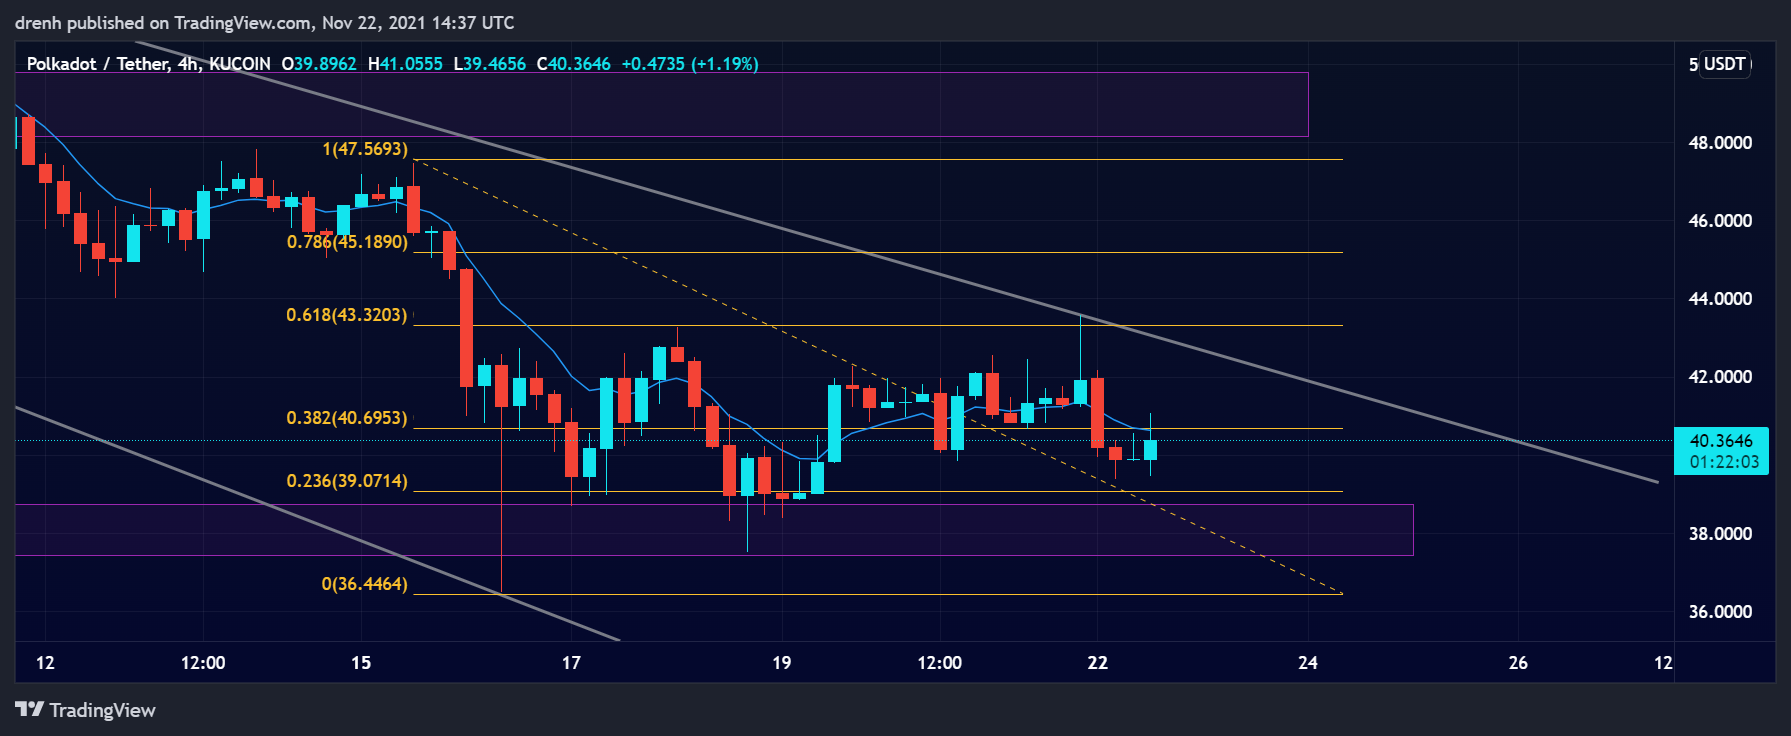
Fibonacci
The Fibonacci retracement levels suggest that DOT had recently encountered resistance at the 61.8% Fibonacci level, indicating that the price could have gone further down. However, due to the strong support, the price is in consolidation, and that the Fibonacci might not be respected.
Price Prediction DOT – November 2021
Based on this technical analysis on Polkadot (DOT), we could see its price go further down if it breaks the projected support structure at $36. The price could go further down to $33. However, this consolidation period of the price could also lead to a potential bullish breakout, other things equal. If BTC maintains its momentum, we could see the trend reverse and the price to retest all-time high. In the long run, if the bull cycle is not over and if the market capitalization keeps increasing, we could see DOT reach $100 eventually.
Latest News for DOT – Affecting Price
With the launch of parachains, Polkadot has expanded its growth opportunities. Acala, a DeFi Protocol, has recently won the first parachain slot in Polkadot after a 32 million DOT bid. Such occasions can largely increase the exposure of Polkadot and increase its price in the long run.
Also read: Polkadot Price Prediction 2021 and Beyond – Is DOT a Good Investment?
 Surges Post-Bitcoin Halving")

