


ETH Technical Analysis – May 2022
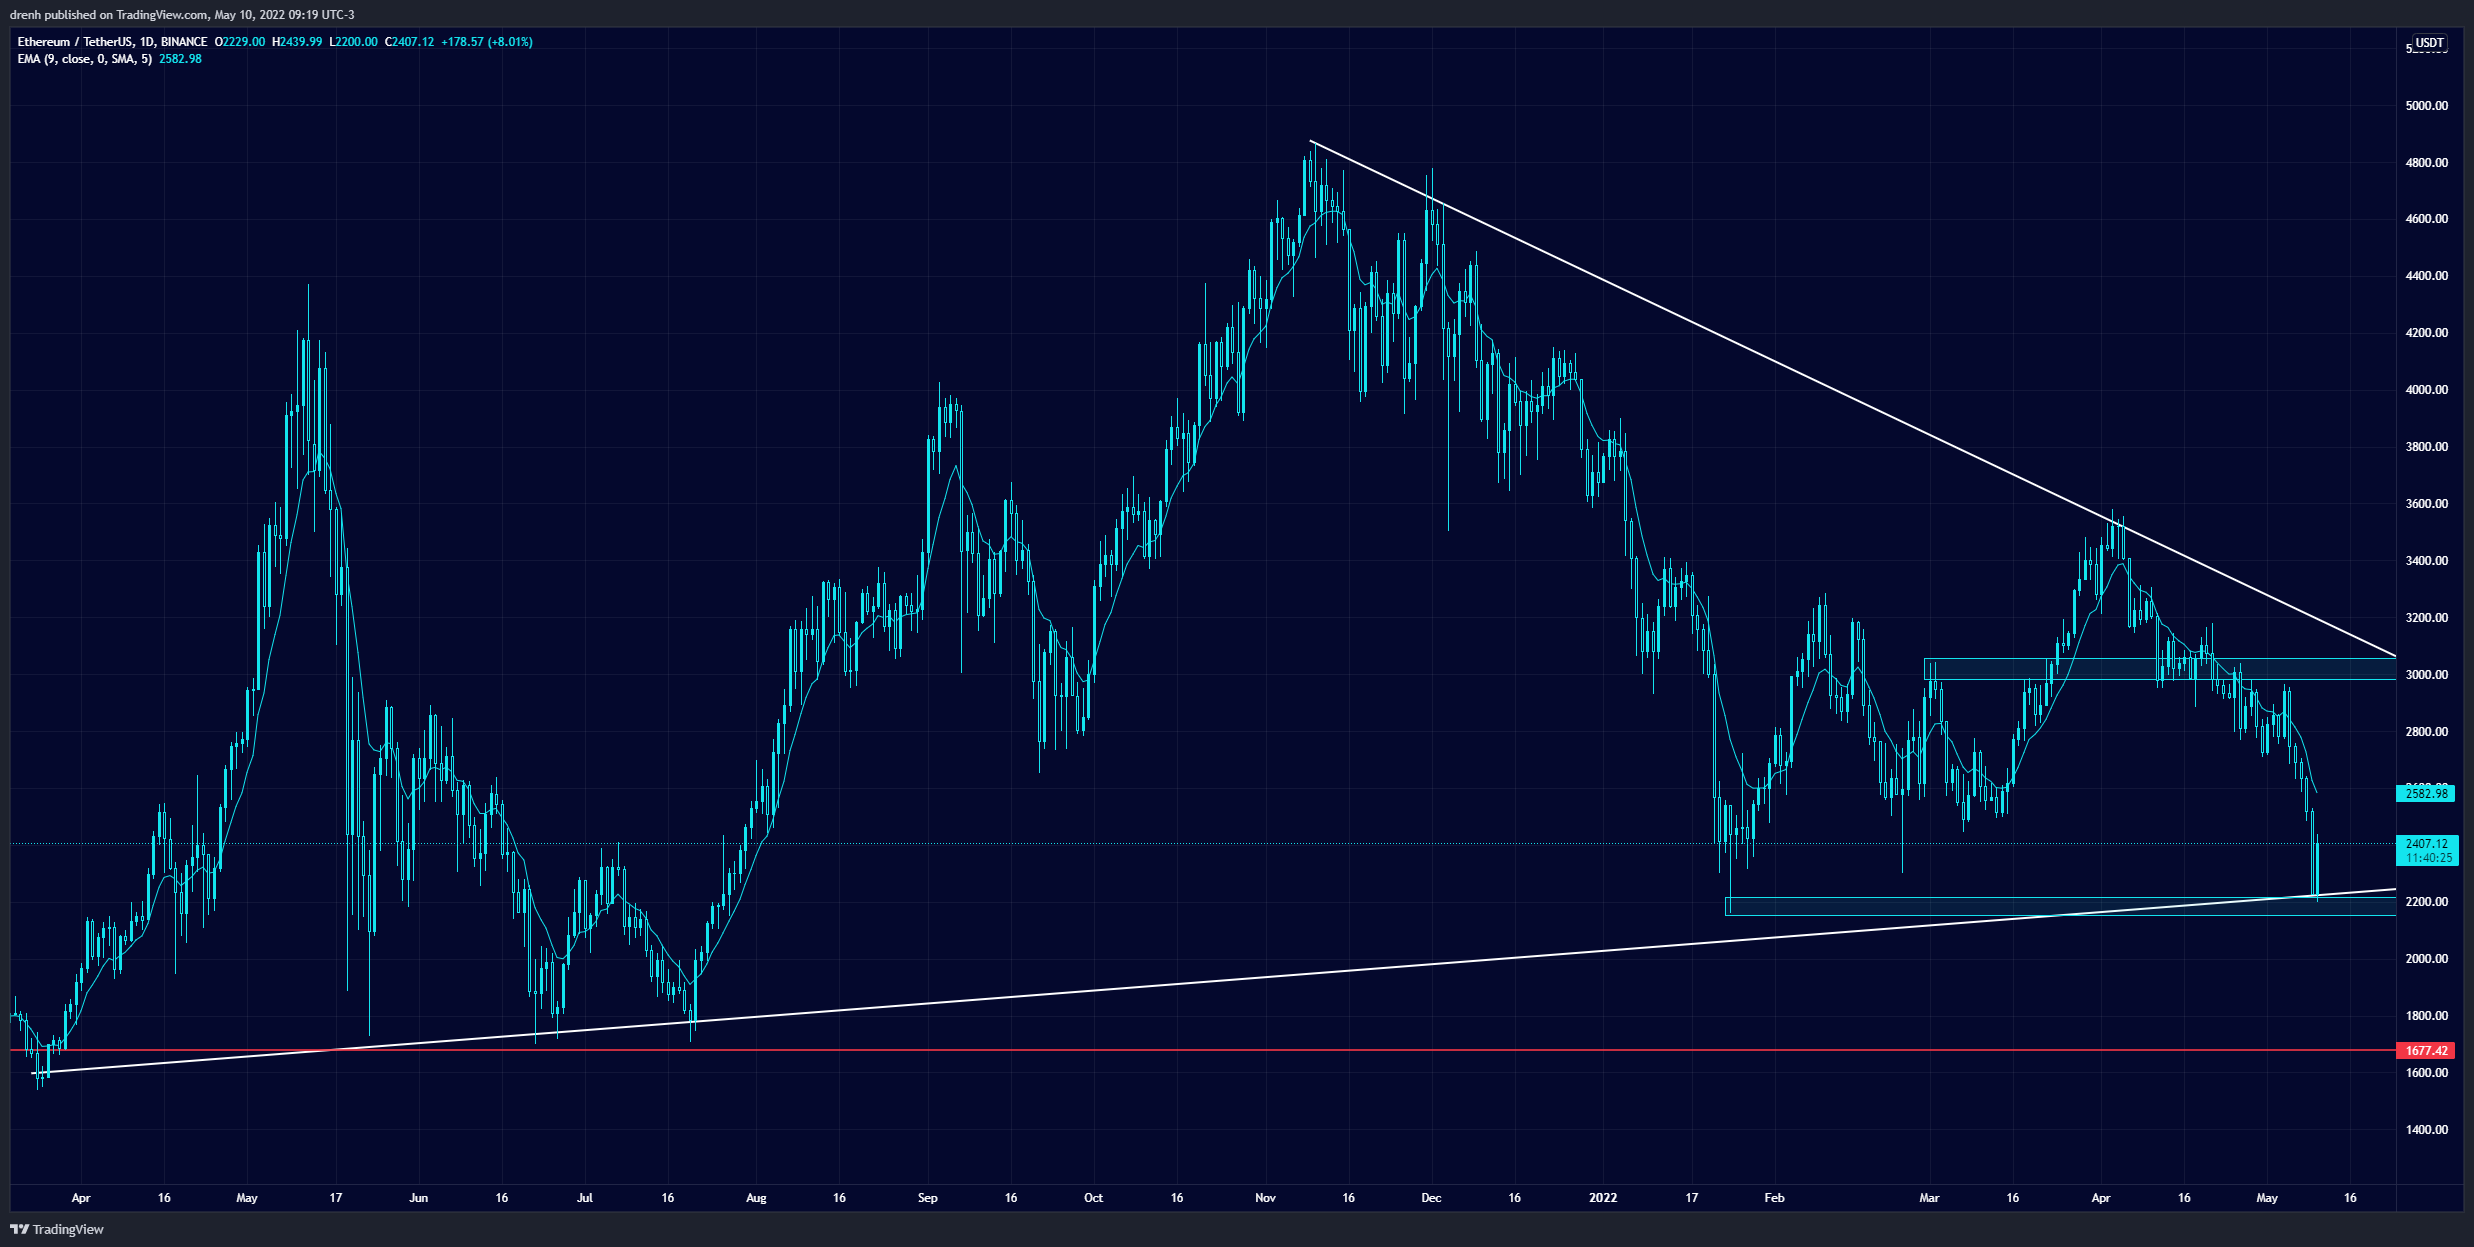
Ever since hitting an all-time high in November of 2021 at around $4,800, the price of Ethereum (ETH) has been in a downtrend. Initially, the price declined by around 26%, and ETH ended the year at $3,500. That bearish momentum continued in January as well, where ETH declined by almost 45% in January alone.
However, ETH managed to find support at $2,160, which then led to a correction in the price. First, ETH surged by more than 50%, indicating a potential trend reversal in the 1-day chart. Nonetheless, ETH was stopped at resistance at $3,200. After another bearish momentum which saw ETH drop to $2,400 – a higher low – ETH had another surge in the price, reaching as high as $3,500 and stopping at the upper trendline of the 1-day chart.
Nonetheless, despite the bullish tendencies in the last few weeks of the first quarter, ETH started declining again in April. So far, the price of Ethereum has declined by almost 40%, suggesting that ETH may continue this downtrend. Recently, ETH found support at $2,200, close to the support zone of January. Hence, the price of ETH is now in correction and may slightly increase so that indicators are in equilibrium once again.
Nonetheless, the fear and greed index of the 1-day chart still shows strong signs of fear, meaning that the selling pressure is still high for the ETH/USDT pair. Bollinger bands show a huge increase in volatility in the last couple of days which led to the price of ETH dropping as low as $2,200. With an increased trading volume due to panic selling, ETH has now plenty of space to recover in the coming days.

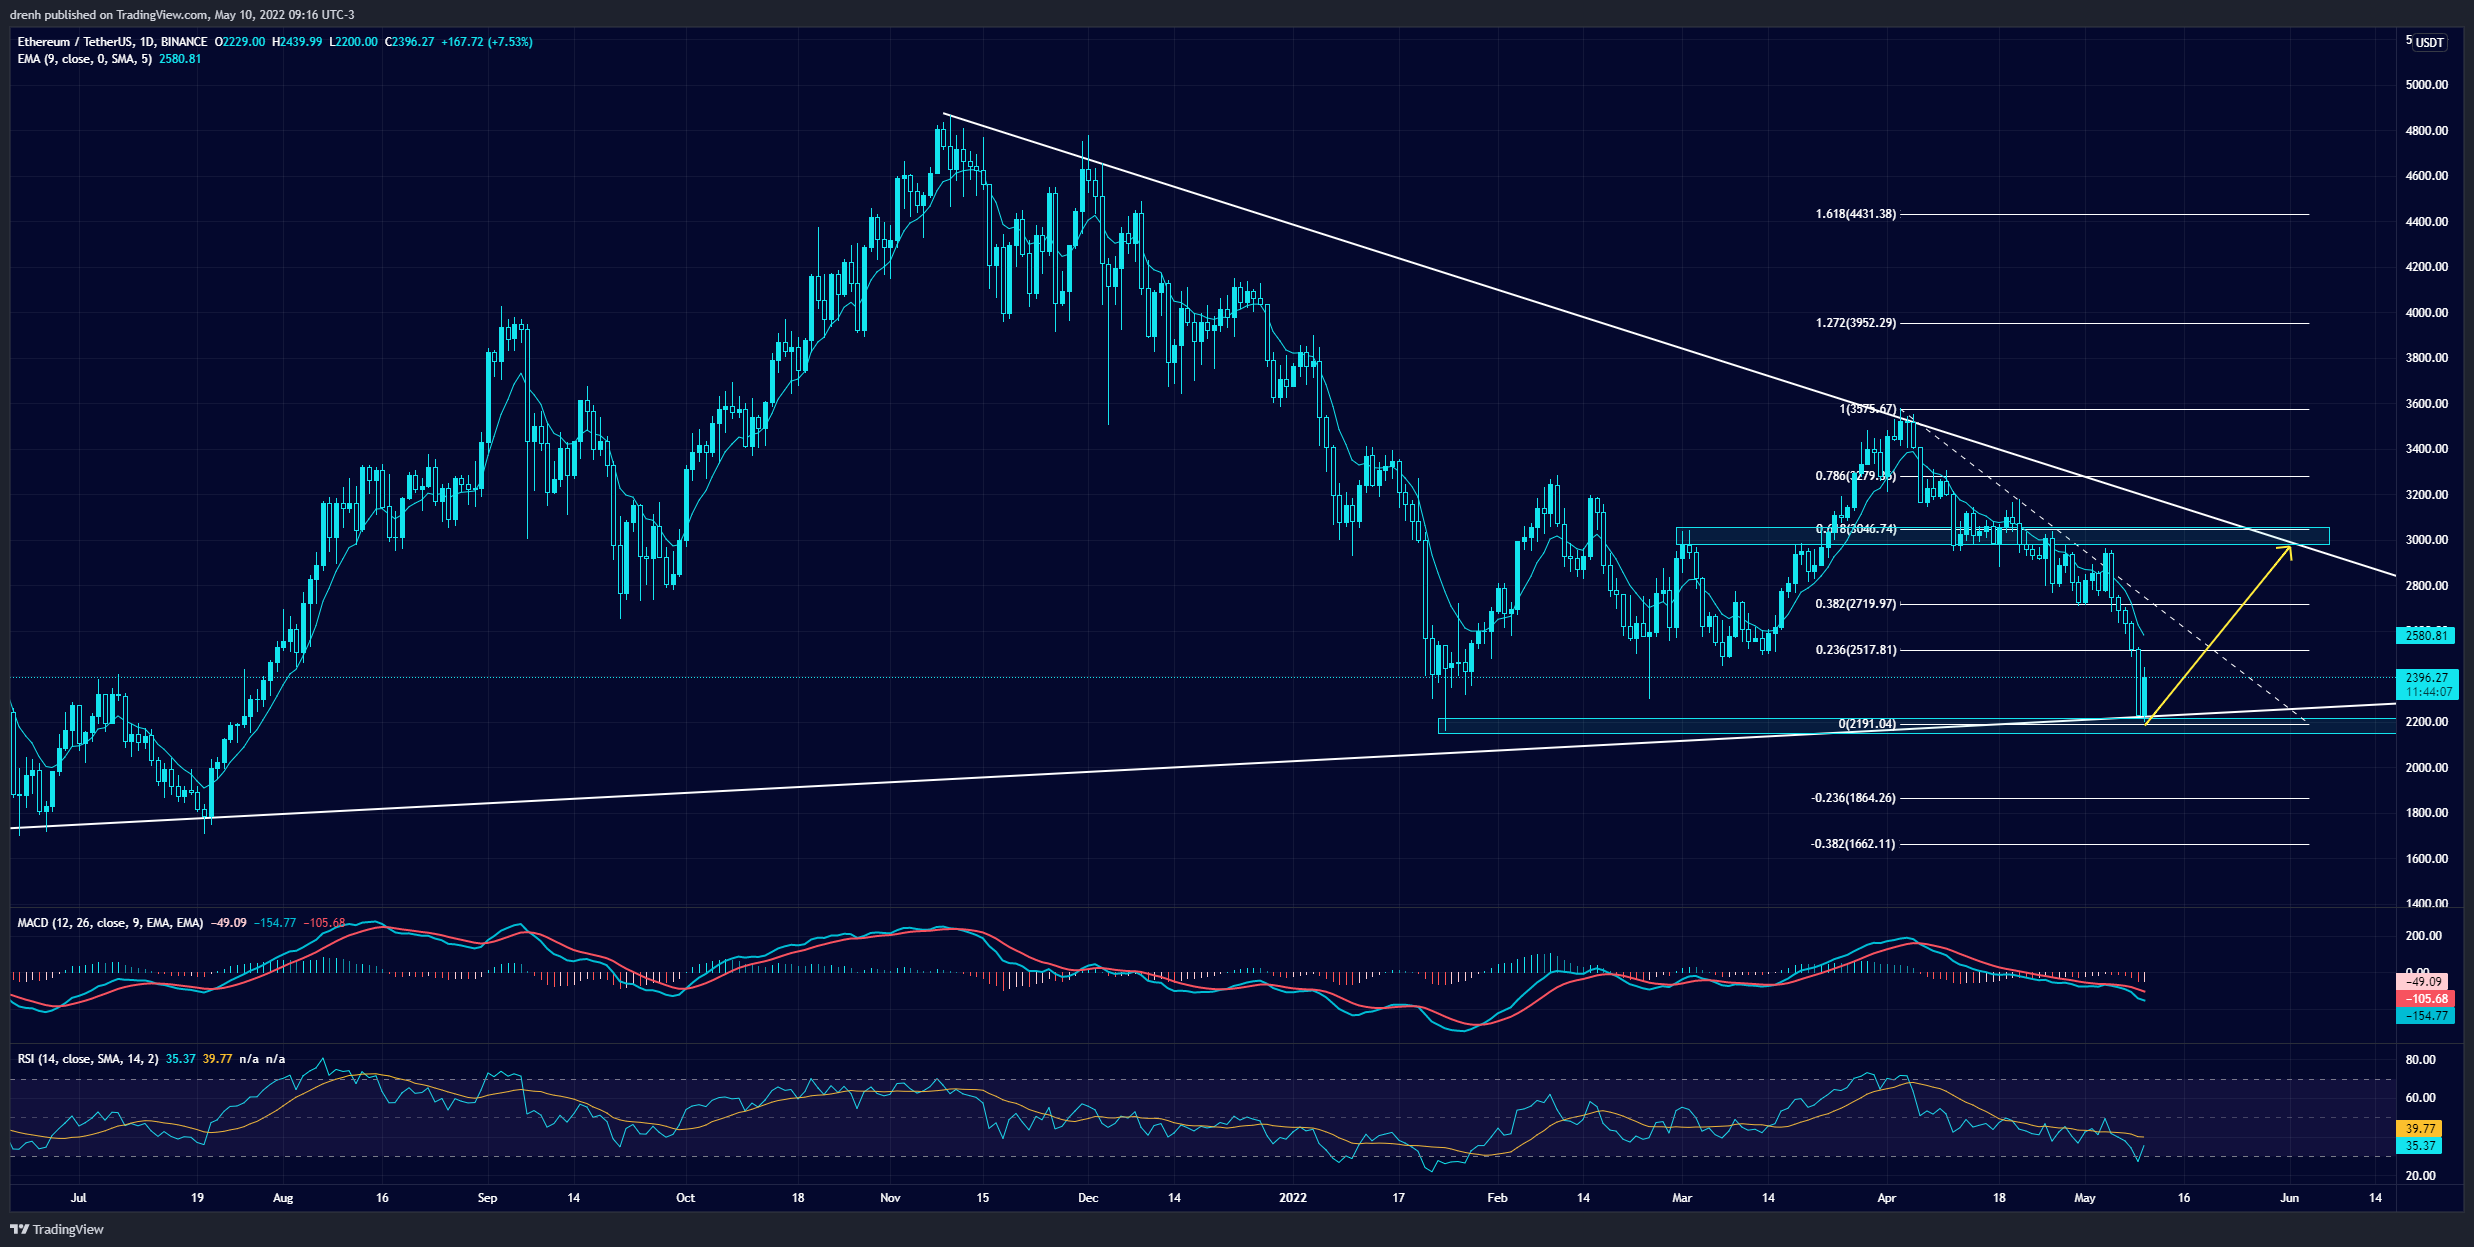
Key Structures
Support
- $2,200
Resistance
- $3,000
Indicators
Moving Average
Both the 20-MA and the 50-MA lines of a 1-day chart are currently well above the price of ETH, meaning that the current trend is bearish for the coming weeks and that the price of ETH may keep declining, other things equal.
The 9-EMA line of a 1-day chart is also above the current price of ETH, despite the recent correction. Hence, the price of ETH could keep declining in the shorter run, and the EMA line may act as resistance to the price if the latter attempts to increase even more.
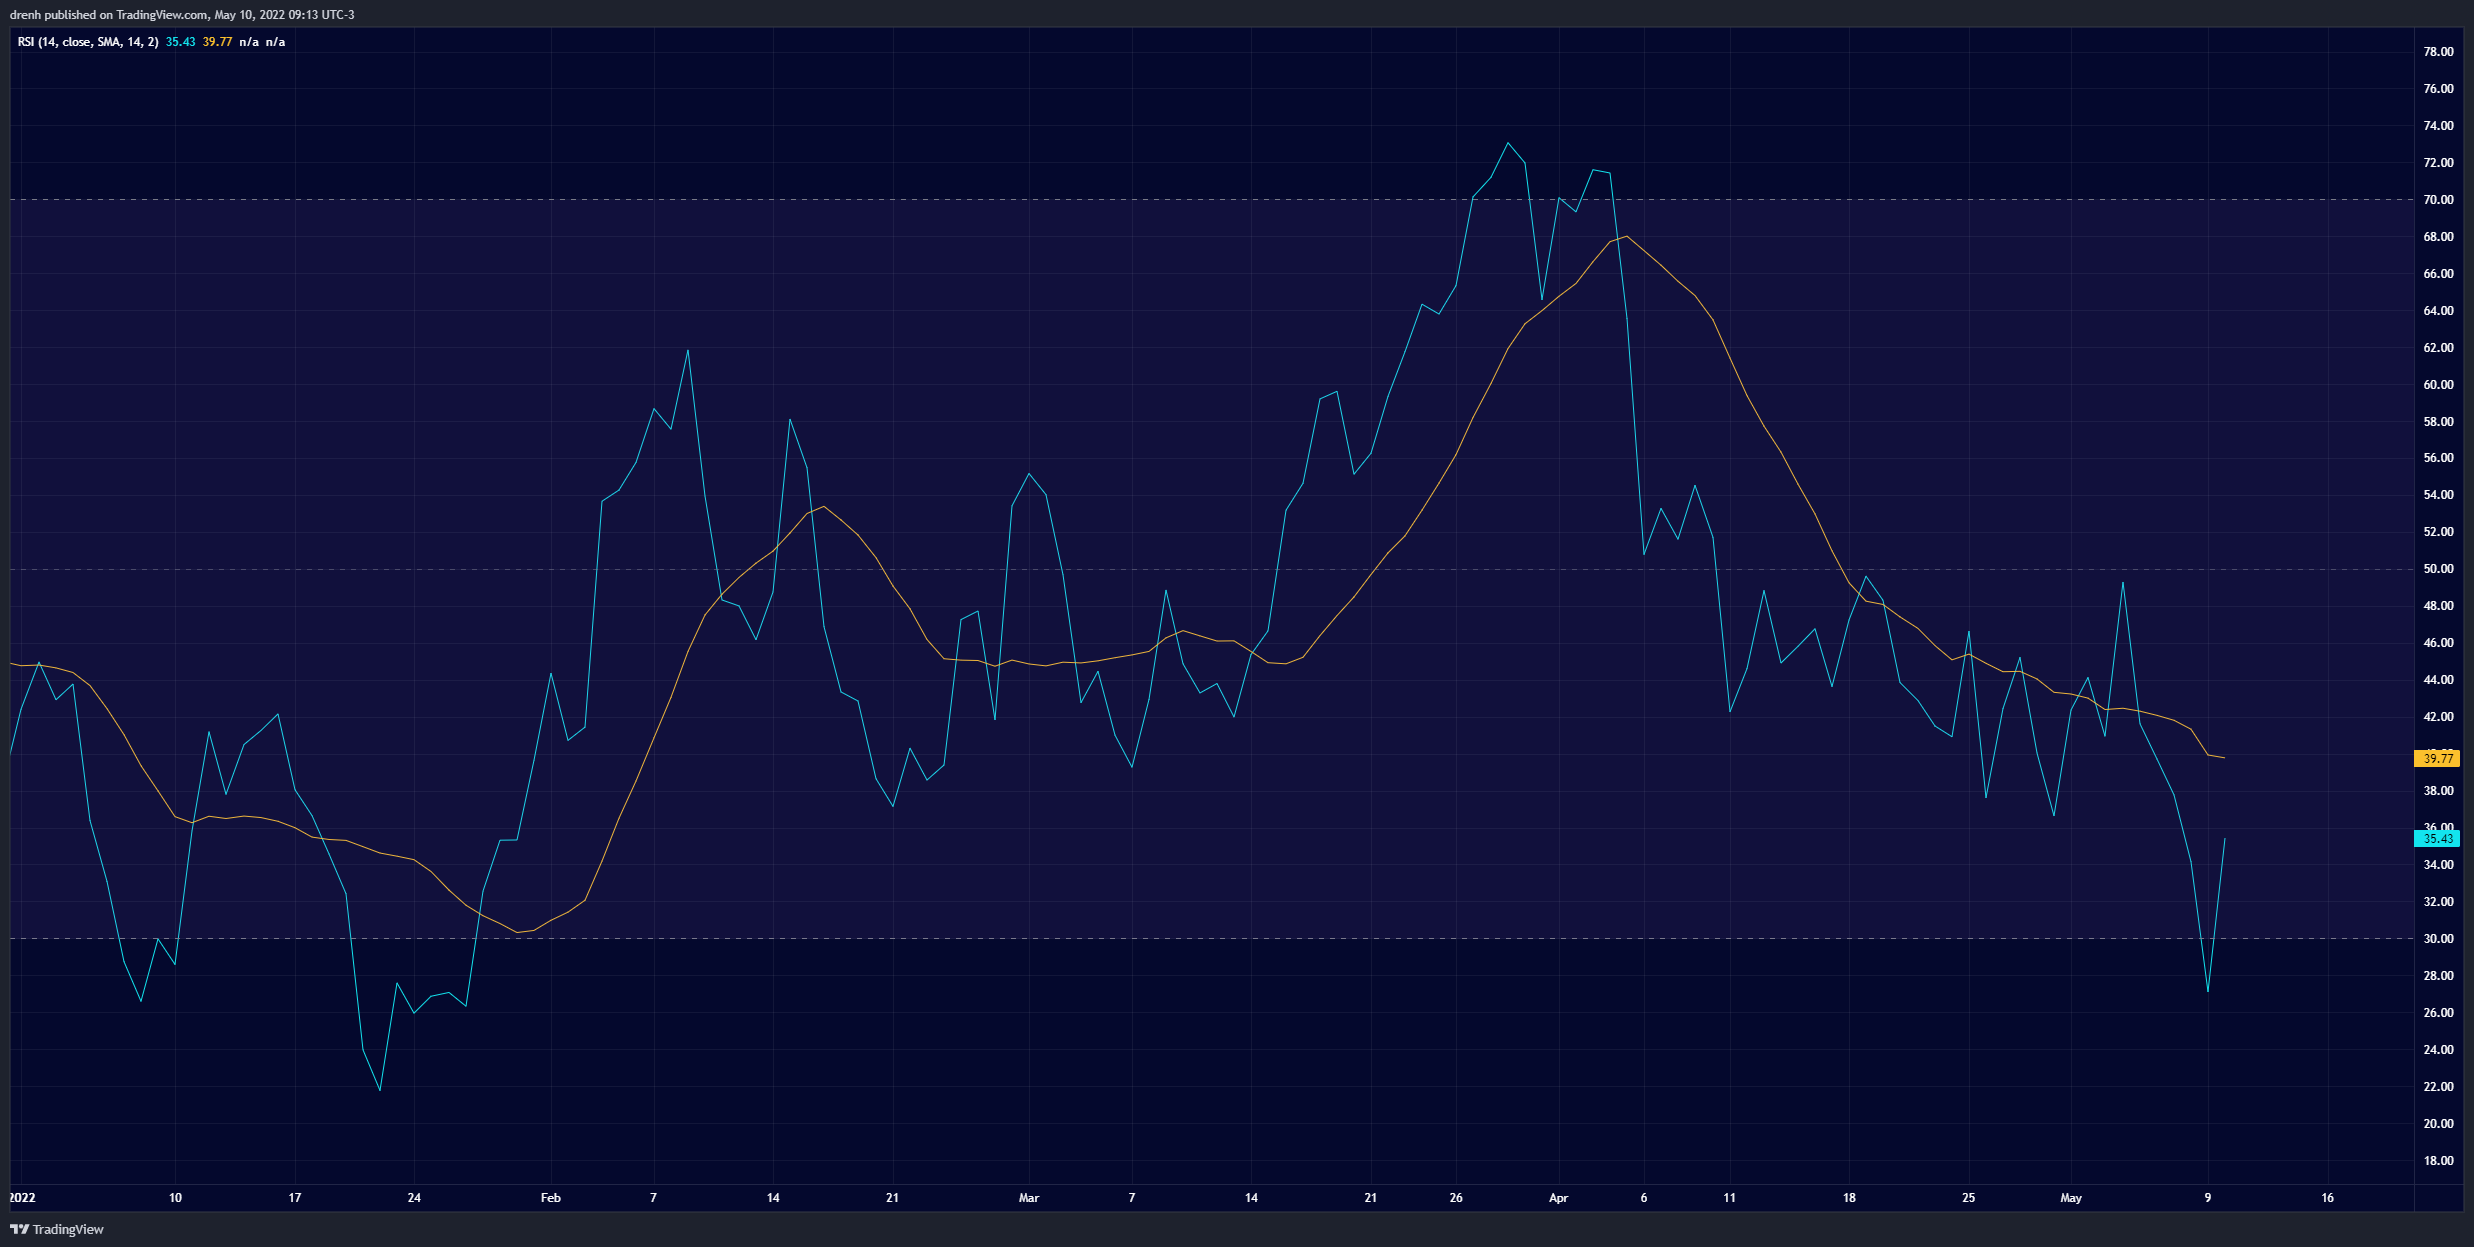
Relative Strength Index
The RSI of a 1-day chart recently hit below 30, meaning that ETH became oversold. Because of that, the price has now started increasing. The RSI is now approaching the equilibrium, but the selling pressure is still relatively high, and ETH remains bearish. Nonetheless, this means that ETH has still plenty of room for growth in the 1-day chart.
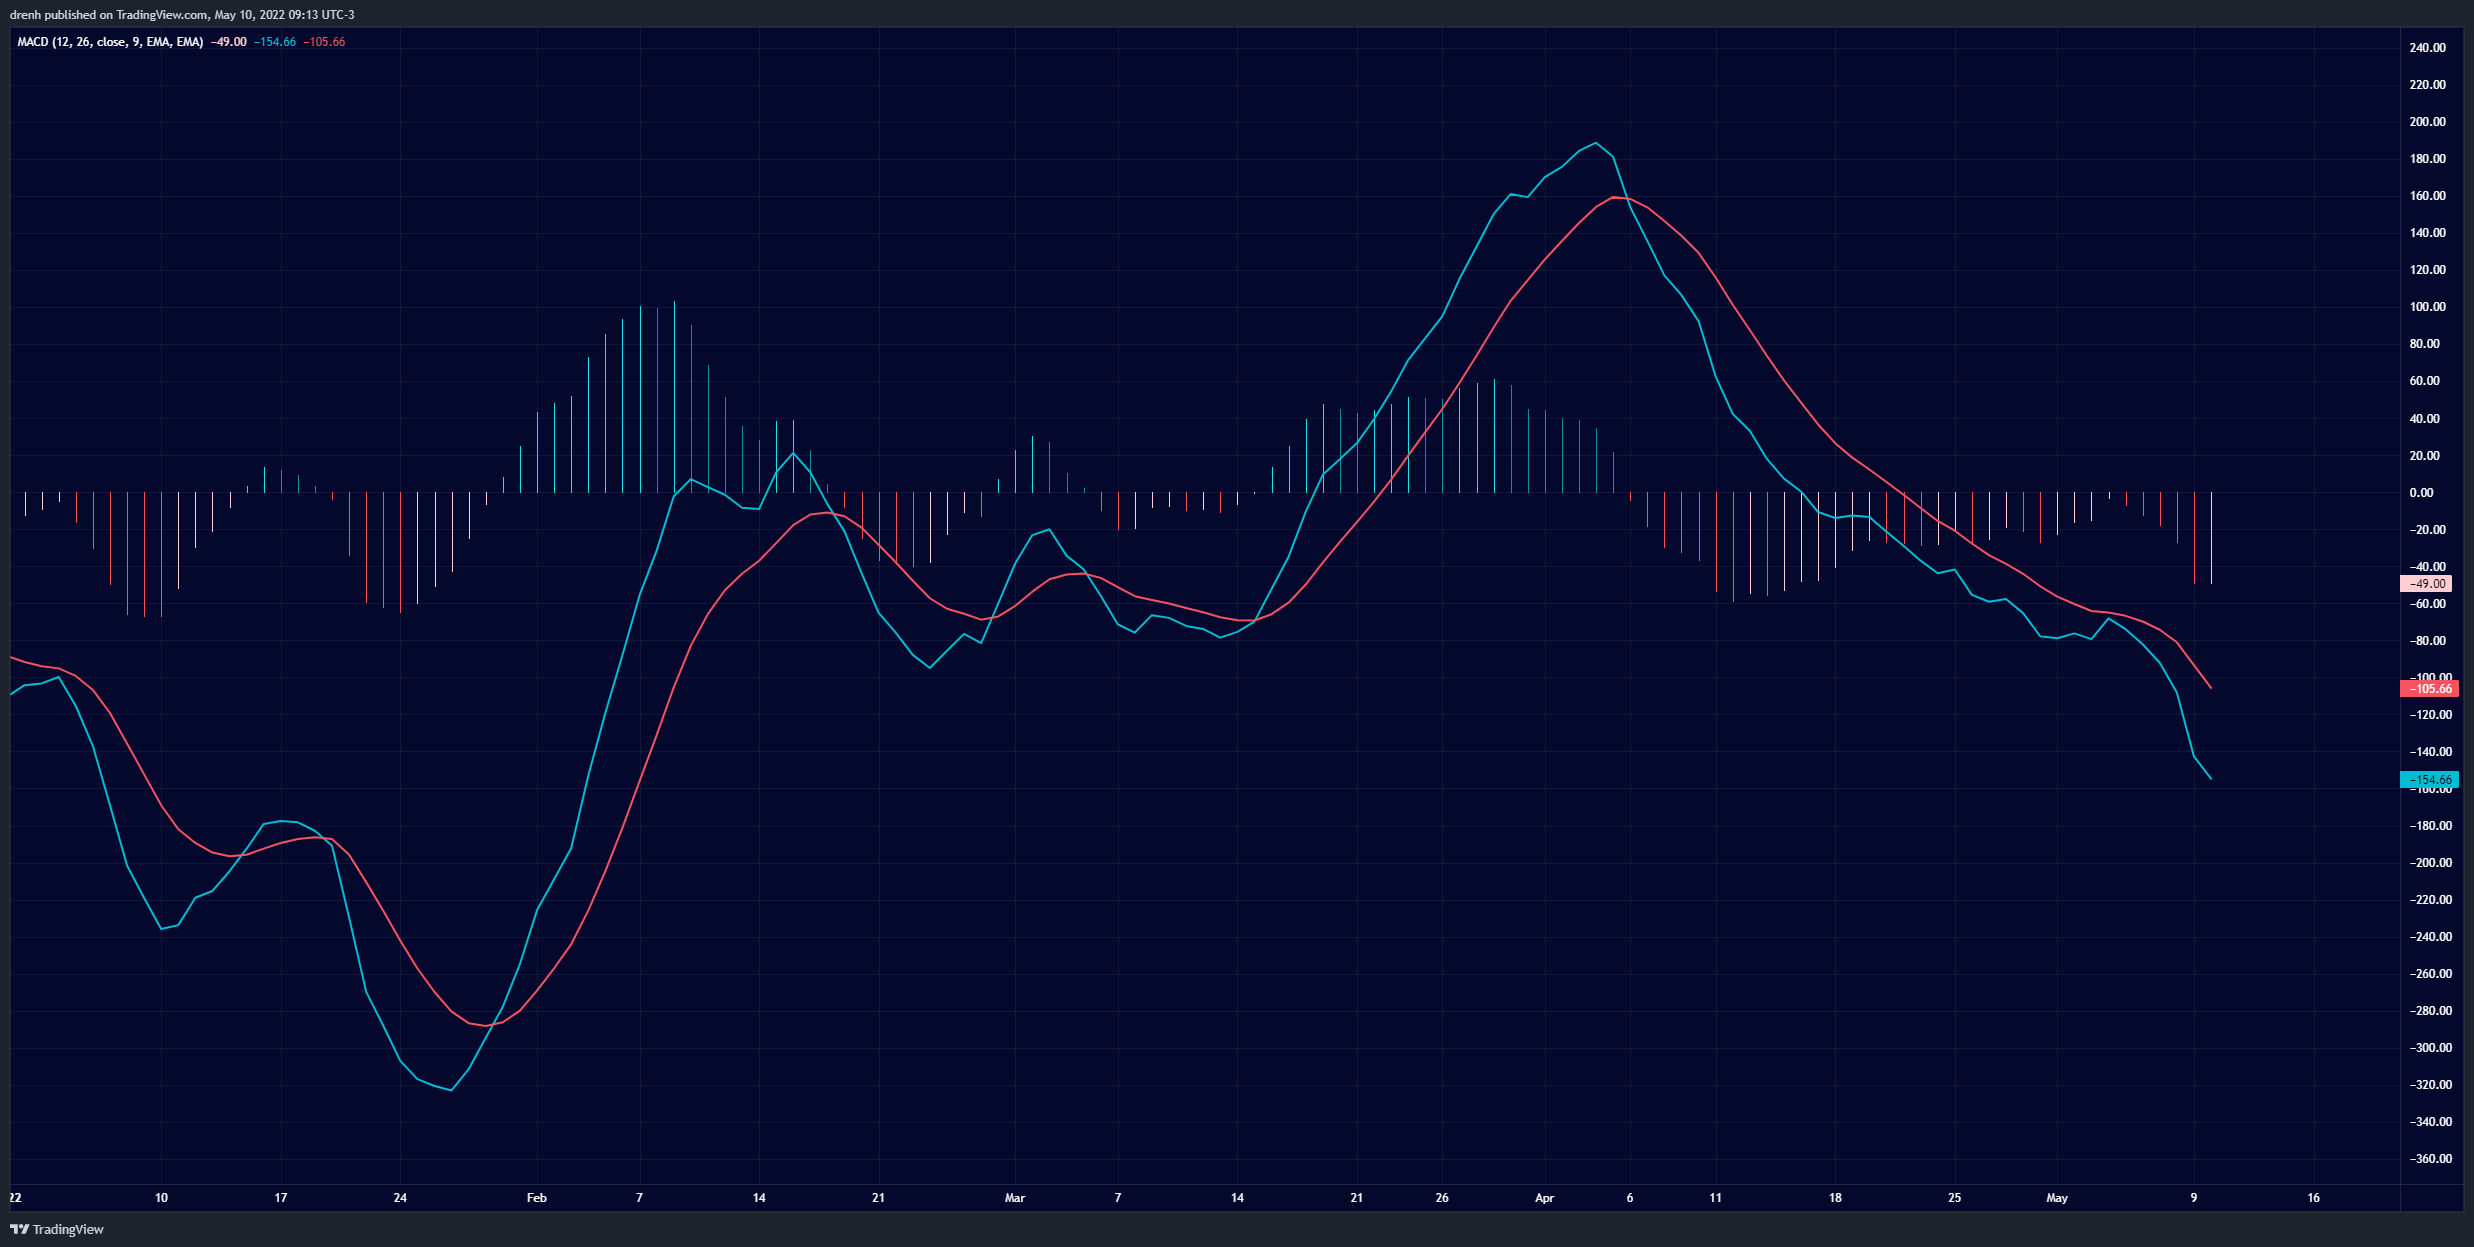
MACD
The MACD line of a 1-day chart is below the signal line and below the baseline, meaning that the momentum is bearish for ETH in the short run. Nonetheless, due to recent support, the lines have started converging. Assuming this pattern continues, then we could eventually see a shift in momentum for ETH in the 1-day chart.
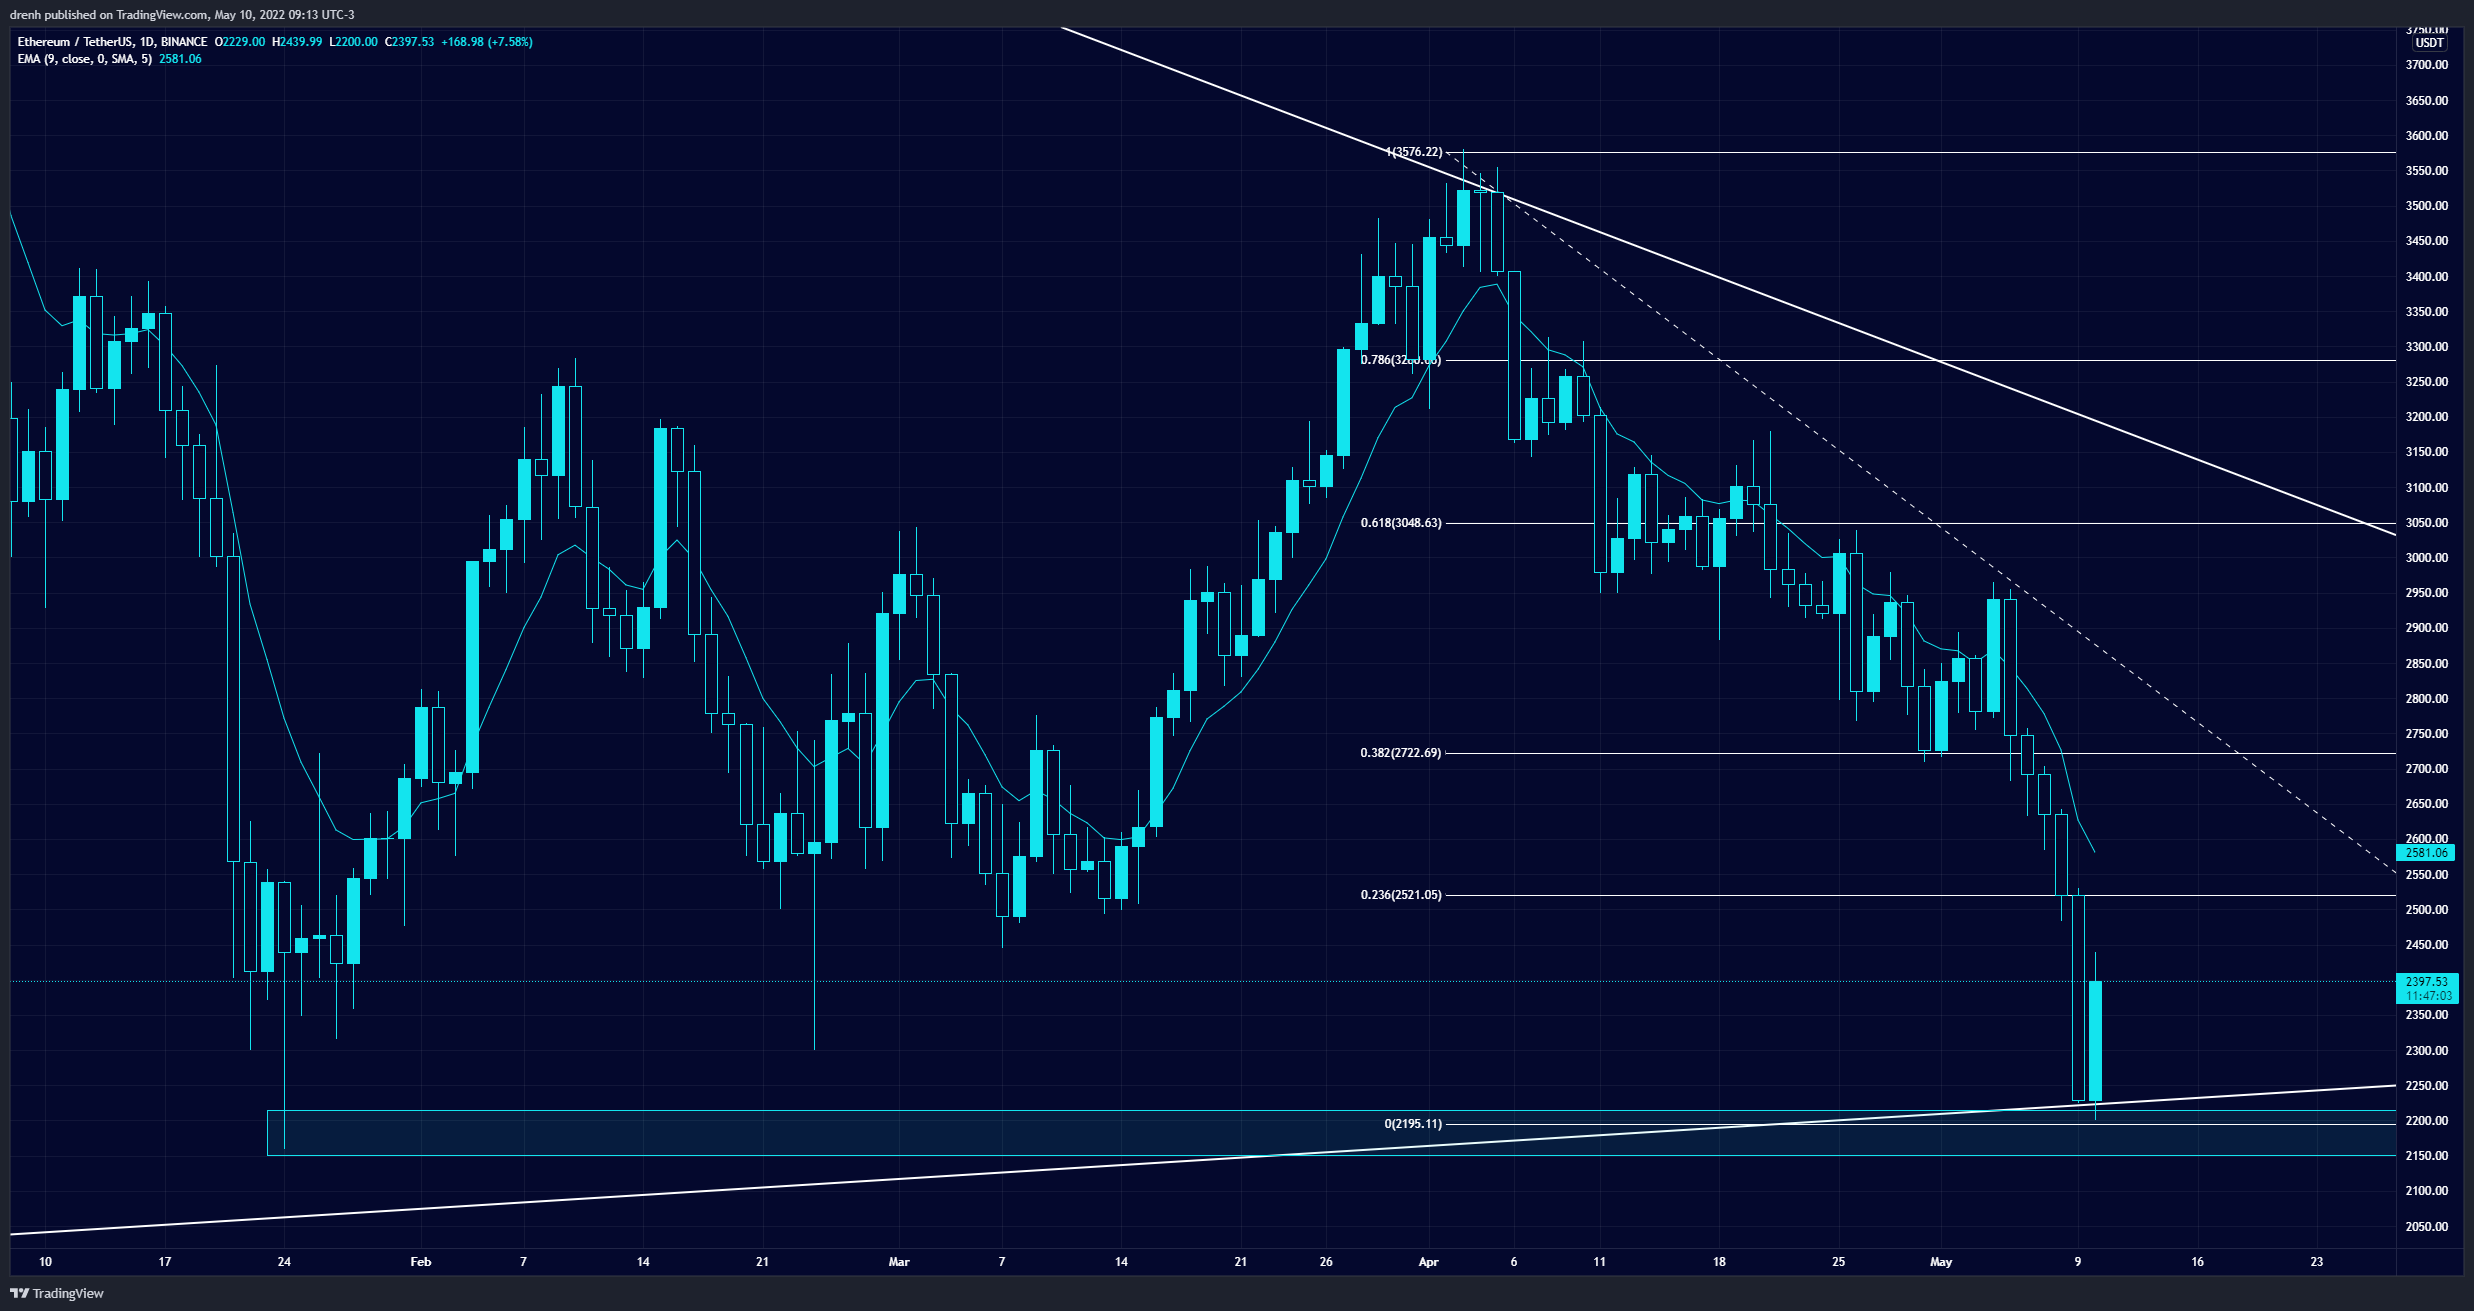
Fibonacci
The Fibonacci retracement levels of a 1-day chart suggest that the price of ETH could go back to the 61.8% level in the coming days, assuming that ETH continues this recovery. However, support at 61.8% could lead to an even bigger dip if the buying pressure remains low.

Price Prediction ETH – May 2022
Based on this technical analysis of Ethereum (ETH), the price of ETH could increase in the coming days. ETH may eventually retest resistance level at $3,000, other things being equal. However, if ETH fails to maintain strong buying pressure at around $2,200, the price of ETH could be going down to as low as $1,600 in the coming weeks. Nonetheless, the price of ETH is highly dependent on the price movement of BTC. If the latter increases in the coming weeks, the same is likely to occur to ETH.
Latest News for ETH – Affecting Price
Besides technical indicators, cryptocurrencies such as Ethereum are largely influenced by fundamental factors. For instance, Facebook’s Meta has recently stated that they will support NFTs from various networks, including Ethereum, Solana, Polygon, and Flow. This is likely to increase the demand for ETH as Facebook users may need ETH for interacting in Facebook’s metaverse.
#Meta’s #Instagram to Support #NFTs From #Ethereum, #Polygon, #Solana, #Flowhttps://t.co/QXPhGuxrS8#Web3 #Technology #NFTCommunity #Metaverse #TechForGood#Fintech #Finserv #Cloud #Innovation #DataScience #Flutter#100DaysOfCode #Python #Marketing #Programming #IoT #Digital
— Dr. Robin Kiera (@stratorob) May 9, 2022
On the other hand, with Ethereum transitioning from PoW to PoS, and with the price of ETH declining, gas fees have slightly declined recently in the Ethereum network. This could as well increase the demand for ETH as trading other assets within the Ethereum ecosystem becomes cheaper.
Ethereum is still widely supported by investors, influencers, and many more. There are rumors that Apple may soon integrate ETH into its system. While they remain rumors, The Moon Carl, one of the biggest crypto influencers, has recently hinted that this integration is going to happen.
Buy #ETH before announces it!
— The Moon (@TheMoonCarl) May 9, 2022
Therefore, ETH could still perform well, despite indicators showing potential signs of a crash in the market, including the stock market and other commodities.