
- Ethereum has been stuck in a range since it hit $3,200.
- The coin is likely to first retest the $2,880 support level before going higher.
- ETH/USD could make a bullish run for the $3,270 and $3,580 resistance levels thereafter.
ETH/USD approaches the support level it recently created, in what looks to be a typical break and retest market model formation. This potential retest is looking to bounce off the $2,880 support level. The support level was formed in a bullish run that was renewed off the $2,450 support level on the 3rd of August. Price broke through the resistance zone at $2,880 and immediately bounced off it to create a new high at $3,200. ETH/USD has been stuck in a range since it hit that high but also looks likely to retest the support level first before going higher.
Key Levels
Resistance Levels: $2,880, $3,270, $3,580
Support Levels: $2,450, $2,880, $1,715
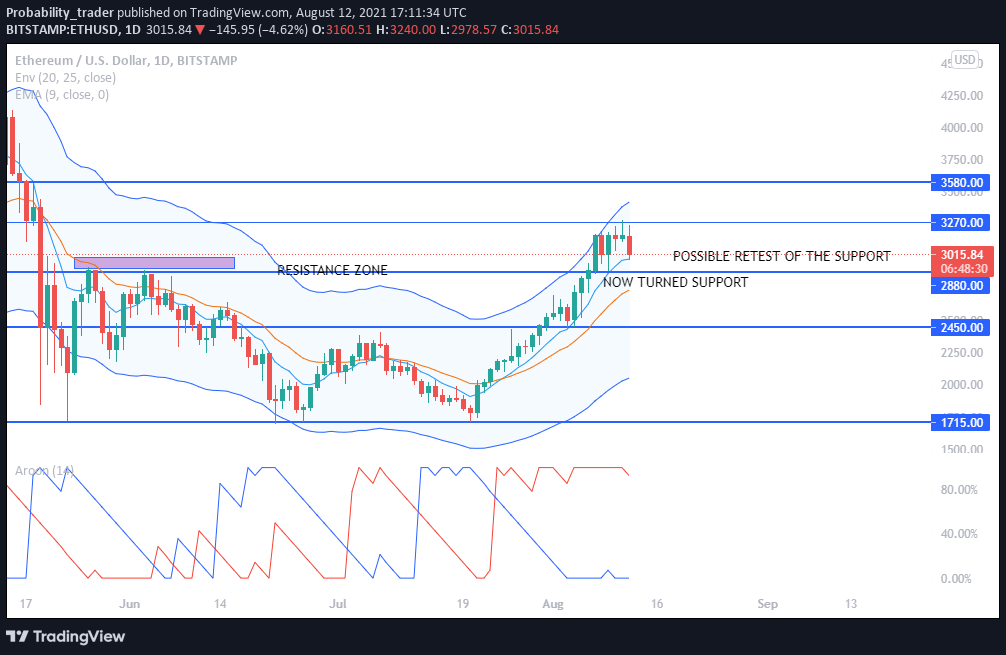

The daily chart shows us that ETH/USD started its renewed bullish run off the $2,450 support level. The coin closed bullish for four consecutive days, thereby increasing its value by 30% during the surge. However, in recent days, ETH/USD appears to have been stuck in a range as it has failed to break the $3,270 resistance level it created above.
Looking at the Aroon trend indicator, we observe that the red line that indicates bearishness has crossed to the upside, and has remained in the 100% zone for days, thus showing us the bears are trying to establish themselves in the market.
Price also looks to be trading in the middle of the channel, even as it looks to dip in between the EMAs (Exponential Moving Average) in the middle of the Envelope indicator. Price trading back to the middle of the channel and in between the EMA would be taken as a sign of the market being in a retracement phase.
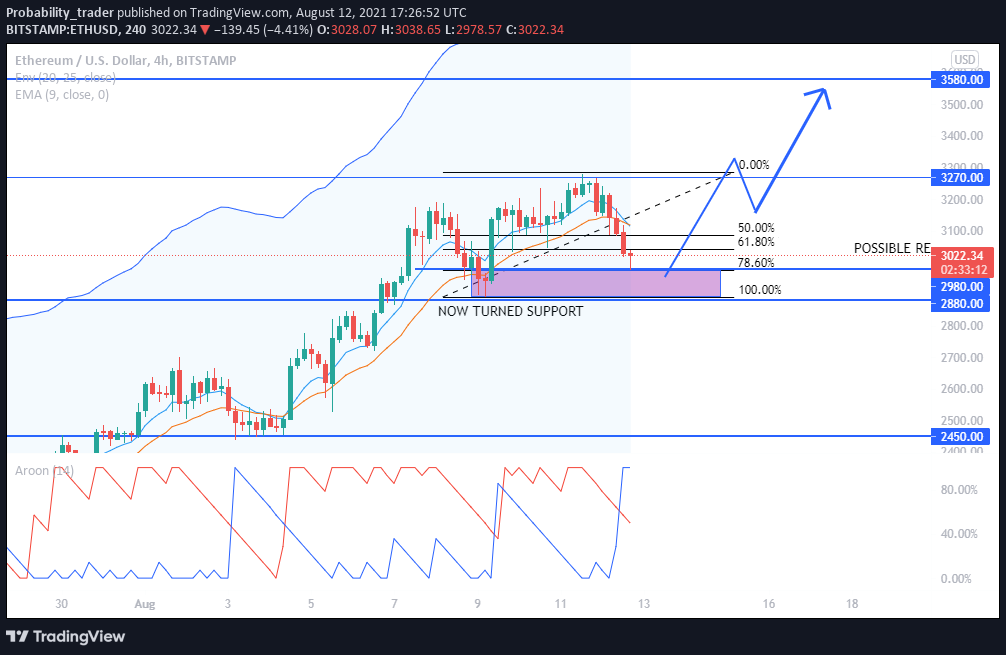
Observing ETH/USD on the 4-hour chart, the Aroon trend identifier indicator is seen to have crossed each other, with the bullish line crossing to the upside. This indicates that the bulls are already working their way into the market, and we can begin to expect bullishness soon. For specific entry points, when we draw the Fibonacci tool on the most recent trading range formed. The Fib’s 78% level is at $2,980. When price trades into this zone, we can look to put on our long positions in the hope of joining the bullish ride-up.
ETH/USD has confirmed it has some targets above the current price level. Should the price retrace and rally off our support level at $2,880, then we could see ETH/USD make a bullish run for the $3,270 and $3,580 resistance levels ahead of it.
Also read Ethereum Price Prediction: ETH/USD Slightly Holds Past $3,000
Note: Crypto-academy.org is not a financial advisor. Do your research before investing your funds in any financial asset or presented product or event. We are not responsible for your investing results.