
- From $2,600, the market rallied past the $2,900 price level with ease.
- The next resistance at $3,350 has proved very obstinate for the coin.
- ETH/USD is expected to drive itself past $3,350 to the next resistance at $3,600.
ETH/USD is laying a siege below the $3,350 key level as it aims to break above it. Ethereum’s bullish drive started as far back as the 21st of July, but it has now hit a major stumbling block at the $3,350 supply level. The rally of the coin has been so impressive that before it climbed above $2,900, it had only had two bearish candlesticks on display – the first a Spinning-Top candlestick, the second a bearish Haramis that indicated a retest to move price above $2,900.
ETH/USD Key Levels
Resistance Levels: $3,350, $3,600, $3,900
Support Levels: $2,900, $2,350, $1,700
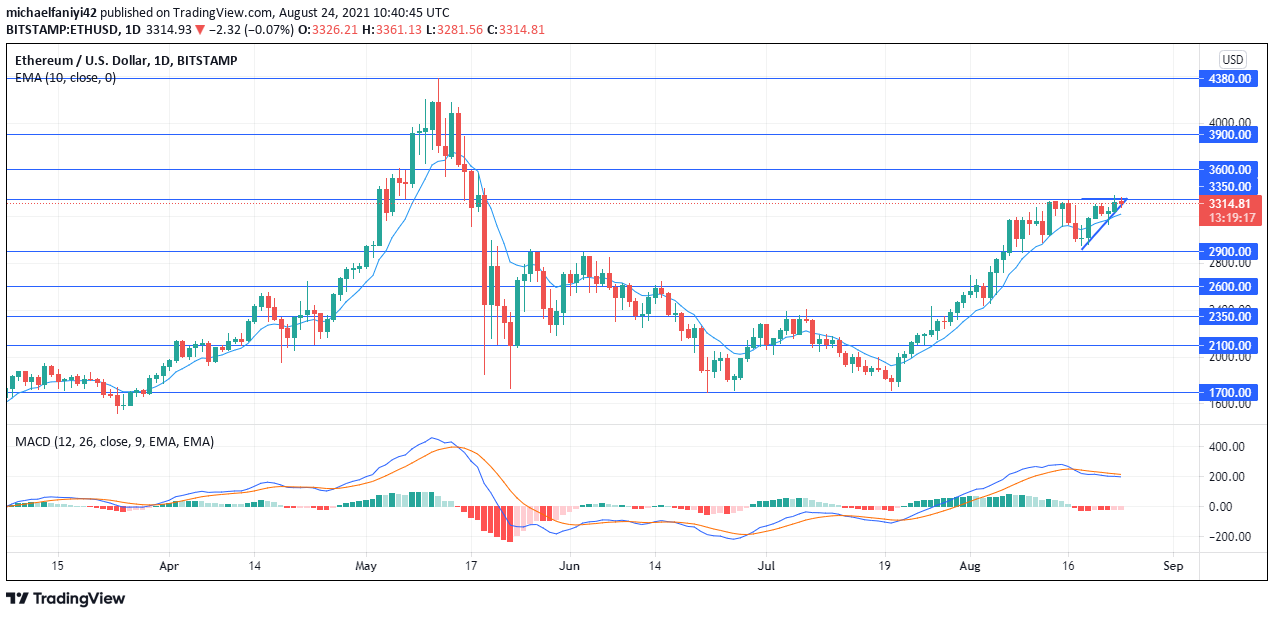

It is noticeable that as bulls ascended higher, the barriers grew stronger. From $1,700, the market rallied past $2,100 with ease. The same can not be said for the next resistance level at $2,350, at which the coin had to retrace slightly to beat the barrier. Ethereum had increased difficulty in moving past $2,600. Price had to lay a siege for 4 days below it to eventually break above it. Surprisingly, the price moved very easily beyond the $2,900 resistance level.
Above the $2,900 price level, ETH/USD hasn’t been finding it very easy. The next resistance at $3,350 has proved very obstinate. There have been multiple knockdowns on the market every time it tries to test it. The coin has since been laying a siege below the price level for the past few days, and it has 7 bearish daily candles already on display. This price level is a major test of the bullish tenacity of Ethereum, but it is expected to overcome it to trade higher.
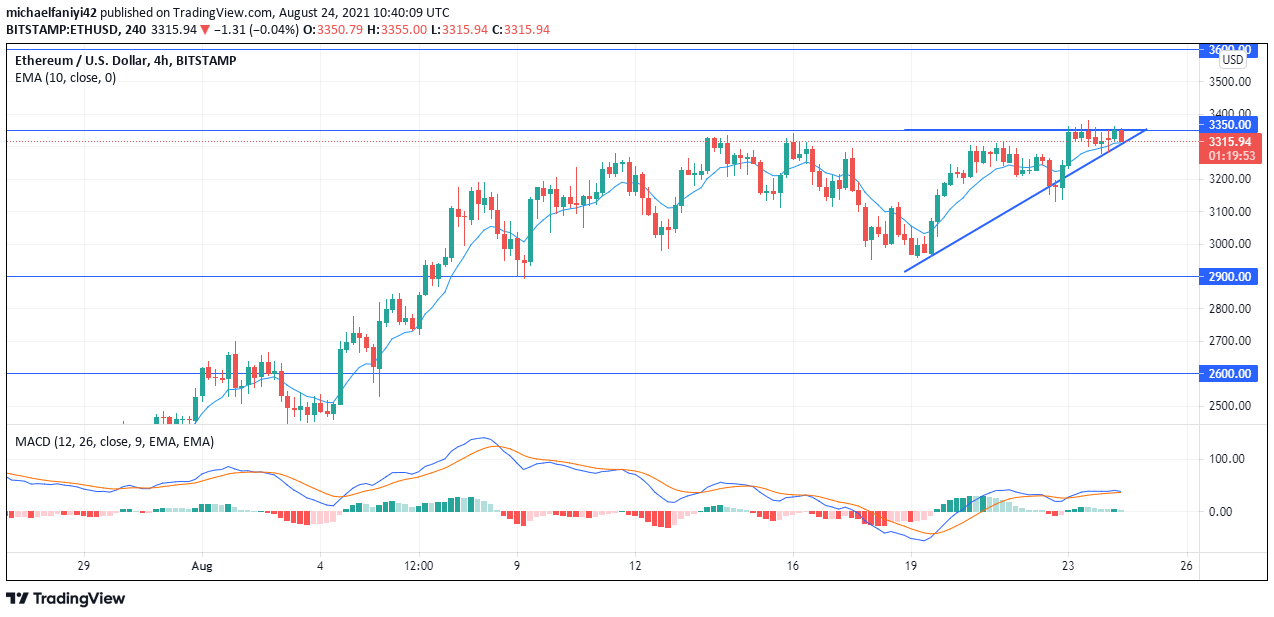
The coin has embarked on a ranging movement for the past 18 days, but that trend looks likely to come to an end after ETH has tapered up an ascending triangle to the resistance line. The EMA period 10 (Exponential Moving Average) is acting as support to push the market up. The MACD (Moving Average Convergence Divergence) is displaying bullish histogram bars to show that the bulls still have the upper hand in the market.
ETH/USD is expected to drive itself past $3,350 to the next resistance at $3,600.
Also read: Should I buy Ethereum?
Note: Crypto-academy.org is not a financial advisor. Do your research before investing your funds in any financial asset or presented product or event. We are not responsible for your investing results.