

Uniswap serves as the gas on the decentralized exchange Uniswap Protocol. Our Uniswap price analysis reveals that the altcoin stabilized after a cup and handle pattern and still going through bearish momentum despite some aggressive momentum built. UNI has seen its best moments in the year 2021; however, at present, just like Bitcoin and Ethereum, it is facing heavy sways due to the newfound trading trend.
On the 5th of January 2022, the year-to-date (YTD) high for UNI was observed when it reached $19.3. For a token that reached a $43.16 all-time high position on the 4th of April 2021, UNI hasn’t been doing too well this year.
Following the overall markets, UNI also took some major dips this year. It plummeted to $4.3 on the 12th of May and even reached a year-to-date (YTD) low of $3.6 on the 19th of June. However, Uniswap price began strengthening on the chart afterward to reach $5.7 on the 27th of June. Like other cryptocurrencies, the price movement for UNI started to improve in August 2022.
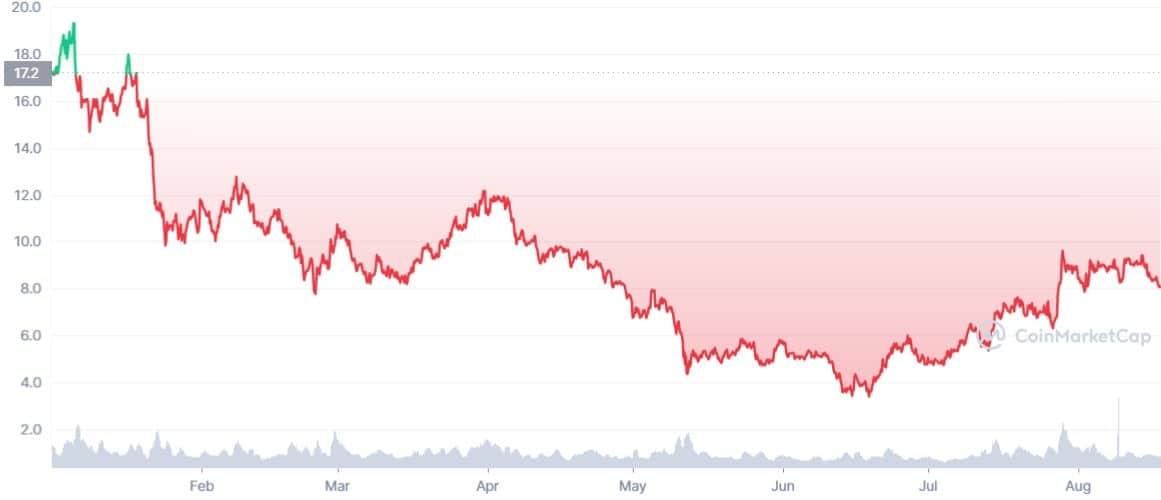

UNI price rose to $9.6 on the 10th of August and $9.6 again on the 14th of August. The general trend is bearish, with the current price at $7.90.
Uniswap Price Analysis: UNI stabilizing above $8 after cup and handle drop
As shown in the chart below, we can see a cup and handle pattern appearing, which suggests a decline in price. The already inconsistent UNI price fell further as traders started selling the currency, pushing the relative strength index (RSI) to hit the oversold zone. The cup and holder pattern suggests a build-up of bearish UNI price movement.
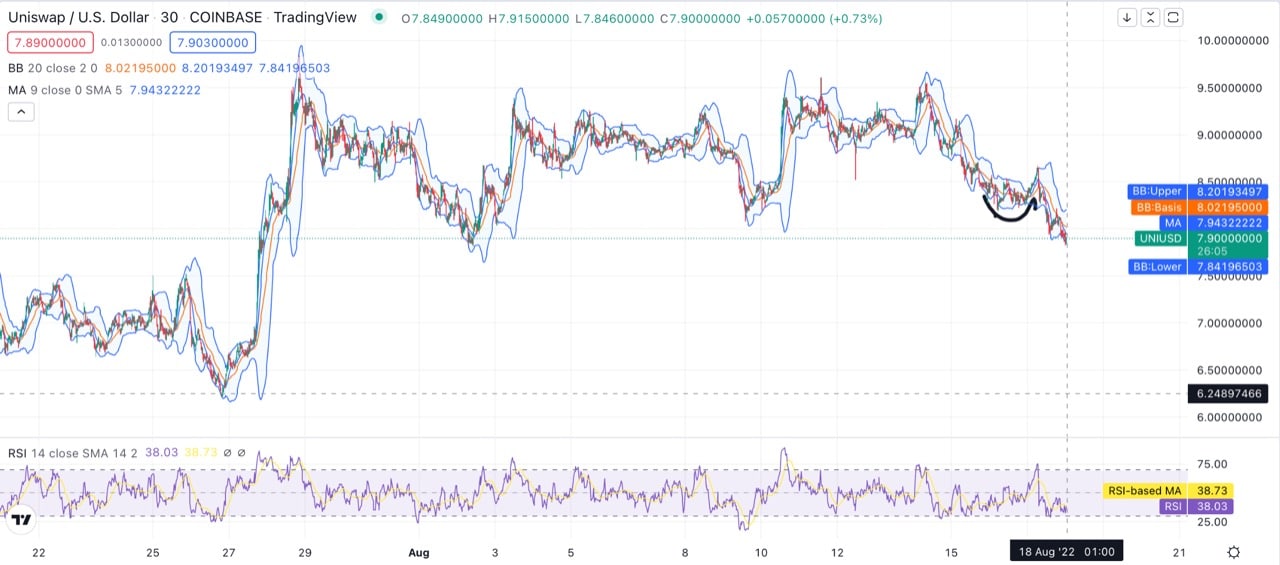

The relative strength index (RSI) indicates a slight bearish UNI price movement on the 17th of August, whereas a bullish UNI price movement was observed on the same date. The Relative Strength Index (RSI) line ascending above 75 indicates overbuying, which results in increased prices.
Uniswap price is still facing strong resistance; at the time of writing this, the price stands at $7.90. Bollinger Band (lower) is providing UNI support being present at $7.8. The RSI index is showing below 50 scores on the chart with ample signs of a overselling momentum. Current RSI score is at 38.03 and the RSI moving average stands at 38.03
Above the current price, UNI faces resistance with the moving average (MA) of $7.94, whereas, the next resistance level comes at Bollinger Band (Basis) placed at $8.02. The strongest resistance was recorded with Bollinger Band (Upper) at $8.20.
If the traders manage to maintain the price at the current levels with some aggressive buying the price might stabilize again, however, if the current support levels fail UNI price can fall back to the monthly low observed at $6.24 on the 26th of July, 2022.
Caution is advised in trading UNI as the market trend is bearish throughout the cryptocurrency sphere and all the top coins are struggling to improve position on the charts.
TakeAways
- Uniswap price fell after a cup and handle formation.
- UNI price stabilized after a bullish streak.
- Uniswap is currently facing strong bearish momentum.
- Price can decline to $6.4 level if the current support gives way.
- Strong resistance is persistent at the time of analysis.
Disclaimer: The information provided on this page is most accurate to the best of our knowledge; however, subject to change due to various market factors. Crypto-Academy encourages our readers to learn more about market factors and risks involved before making investment decisions.