


Traders and analysts always have their eyes on any slight indication that might help them understand future prices and ultimately, whether to buy or sell an asset or cryptocurrency. For instance, Bollinger Bands, RSI, and moving averages are some of the few that one may put into use in these types of situations. You may have heard of the term trading volume before, and that’s likely why you’re here. Trading volume is one of the most useful tools for determining how virtual currency prices fluctuate.
To sum it up, the trading volume of a cryptocurrency is essentially the total amount of coins that have changed hands in a particular period of time, and in most cases 24 hours. In other words, a cryptocurrency’s 24-hour trading volume measures how much value has been purchased and/or sold throughout an entire day.
If you want to learn more about trading volume and how it affects cryptocurrencies and the investment strategies of analysts or traders, you’ve come to the right place. We’ll explain how trading volume works, what it means, and how it affects the price of assets and cryptocurrencies in this Crypto Academy article.
What is Crypto Trading Volume?
So what exactly is crypto trading volume? As mentioned above, trading volume can be defined as the number of coins that have changed hands within a certain period of time. In other words, a cryptocurrency’s 24-hour trading volume is the amount of money that has been purchased and traded in a single day.
In most cases, you can always find the trading volume of a cryptocurrency on exchange platforms, which is not necessarily representative of the cryptocurrency’s total trading volume throughout the market. With that said, before deciding to invest in crypto, it’s crucial to consider a cryptocurrency’s overall trading volume, not just the volume shown on a specific exchange.
According to experts at CNBC, individuals and institutional investors alike poured money into Bitcoin and other digital assets in 2021 so far. Coinbase, one of the world’s most prominent exchange platforms, reported roughly $335 billion in trading activity in just the first quarter of this year. $120 billion of this was owed to retail investing and another $215 in institutional trading. In the first quarter of 2020, trading volume was only just above $30 billion.
For those that consider themselves expert traders, trading volume is generally seen as the most significant indicator and factor to consider since it reflects the coin’s usual pace of movement and alerts them to any unusual deviations. When a coin moves, this can tell investors that money will either be gained or lost.
If on the other hand, a currency with overall modest trade volumes suddenly spikes, this can imply increasing support and a potential price increase. Investors may forecast what direction a cryptocurrency is headed by simply analyzing its volume over short and extended periods. According to the Wall Street Journal, trading volume has climbed during the pandemic as a growing number of investors have gained access to crypto markets.
A Technical Definition
Simply put, a crypto’s trading volume is the number of coins exchanged over a period of time. This can be easily depicted through a graph with green and red vertical bars. For instance, volume bars on the 12-hour ETH chart represent the amount of ETH that changed hands during that time period. The volume bar on a 20-minute ETH chart, on the other hand, shows the quantity of ETH traded within that time period.

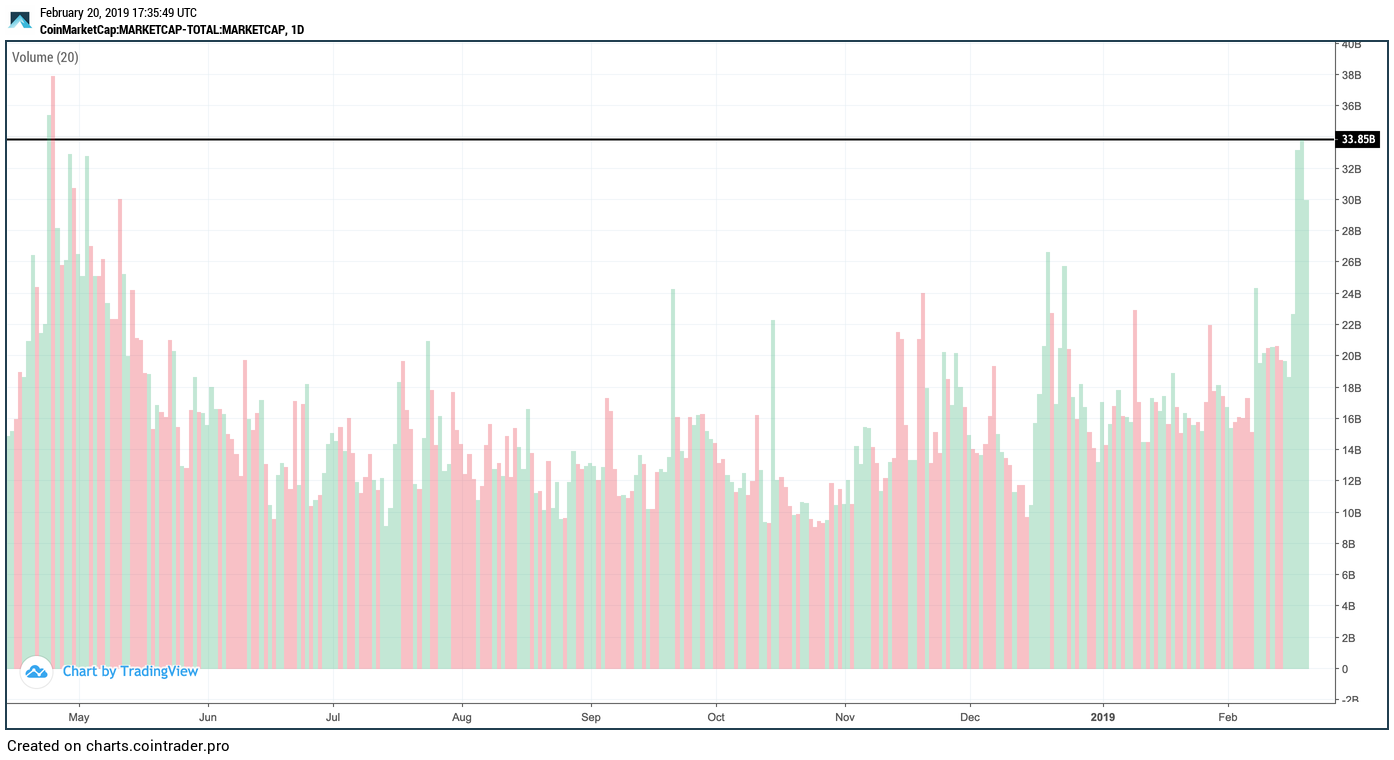
It’s also easy to mix up conceptions behind the color of the bars. Don’t be fooled however as many people believe that green bars represent purchase volumes and red bars represent sell volume. In actuality, the bar’s color is only a reflection of the price candle’s closing direction and does not accurately reflect the underlying trading volume’s directional quality.
How Do You Use Trading Volume?
So now we get to the fun part. How do you use trading volume? Volume acts as a crucial indicator that provides traders with crucial information about breakouts, trend shifts, and the strength of a particular trend. Even then, trading volume can also be used to determine whether or not any changes in the crypto market should be considered.
Example of Trading Volume
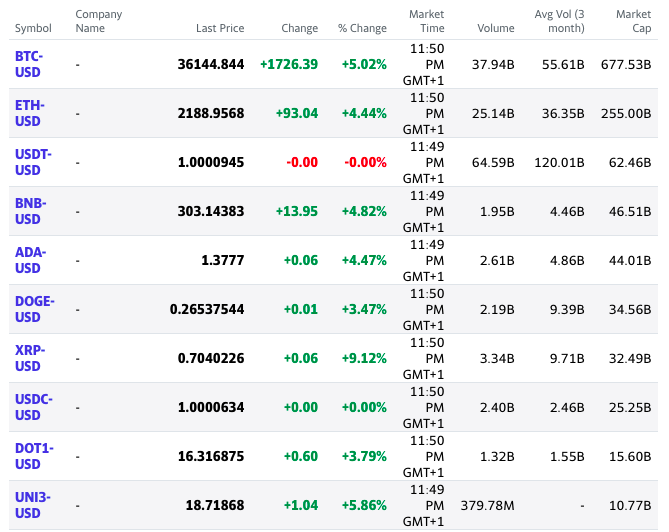
Let’s put things into perspective. A coin trading volume on Coinmarketcap is very straightforward. It’s purely the total value of the coin exchanged in the last 24 hours. In the previous day, for instance, almost $33 billion worth of Bitcoin has changed hands. You can even put it differently and convert that into EUR worth of Bitcoin to put it into perspective.
Because of the numerous ways in which a trading volume can be broken down, it’s often the most significant measure for the majority of cryptocurrencies. A coin’s orientation and motions can be deduced from its volume. For traders, it’s a crucial measure. Volume may be scrutinized in great detail.
When Can You Assess Trading Volume?
On Coinmarketcap, you have the option to view volume by either the past 24 hours, the last week, or even the last 30 days. By seeing the differences between the different periods, you can determine if recent coin swings are an outlier or a trend. If a coin has a large volume, it will not draw notice in most cases if it has frequent heavy motions. Heavy trade within 24 hours might imply there is some support behind the move a coin is making if it typically has less volume.

How do Trading Volume and Crypto Prices Work Hand-in-Hand?
A high trading volume attracts a large number of market participants for many reasons. If for instance, there is a consistently high volume of trades and traders maintain the course, the value of fresh orders will need to rise.
If, on the other hand, the volume falls, the price will likely also fall along with it as there will be no demand to buy the exchange’s inventory. Many profitable crypto trades can be found by carefully assessing the order book and volume.
The Link Between Trading Volumes and Crypto Strategies
Another big use behind trading volume is being able to form trading strategies. You can utilize the Bitcoin trading volume to obtain useful market information whether you are day trading crypto or storing your digital assets for the long term.
With that said, the volume of Bitcoin trading has had a major effect on crypto trading techniques and financial decision-making. Volumes may be used by traders to find the following crypto trading signals:
- Price overhands: After a period of extreme price movements in either direction, a big and sudden increase in volume together with overall modest price fluctuations might signal a threatening reversal, in which the coin’s value will move in the other direction.
- Validate patterns: In a bull market, a large trading volume coupled with strong buyer excitement is needed to keep prices in the uprising direction. As a result, when both volume and price are growing, it’s usually a positive sign. When the price of a digital asset rises but on the other hand the trading volume falls, it’s an indication that a possible reversal is approaching.
- Projects that are no longer active: While there are over thousands of cryptocurrencies on the market, and new ones coming in every day, not every one of them has an active project behind it. Being able to monitor a cryptocurrency’s current and historical trading volume is a great method to reduce your risks by weeding out dead coins with low daily volumes.
- Burnout spurs: Keeping an eye on the trade volume can also help you spot burnout spurs. A burnout spur, which includes a rapid move in any direction as well as considerable volume rise, might signal the conclusion of a trend.
Advantages of Volume Trading Over Other Strategies
Assessing trading volume is always helpful to a trader because most technical analysis indicators are calculated using the price. As a result, certain indicators, such as moving averages are very often referred to as lagging indicators in respect to the price because they have what’s called a “time lag.”
Trading volume, on the other hand, is a price-independent variable that the trader may access in real-time. As a result, volume indicators are a reliable and independent source of information while trading and can nonetheless be used to predict future price movements. The whole idea is that volume forecasts price changes in general. This indicates that a reduction in volume signals a shift in trend. As a result, volume analysis can detect stability among different trends.
Takeaways
- The trading volume of a cryptocurrency is essentially the total amount of coins that have changed hands in a particular period of time and in most cases 24 hours.
- When it comes to long-term investing or even day trading cryptocurrencies, including crypto trading volumes as one of your key factors to consider may help you see important market patterns.
- It may help avoid making the mistakes that others make by selling your investment too soon. Keep in mind that in every area, time will always be your strongest ally.
- Volume indicators are a reliable and independent source of information while trading and can nonetheless be used to predict future price movements.
- Coinbase, one of the world’s most prominent exchange platforms, reported roughly $335 billion in trading activity in just the first quarter of this year