Facebook X (Twitter) Instagram
    Crypto AcademyCrypto Academy
    • Home
    • News
    • Price Predictions
    • Price Analysis
    • NFTs
    • Learn
    • Press Releases
    • Coins
      • Bitcoin
      • Ethereum
      • Cardano
      • Safemoon
      • Dogecoin
    • Advertise on Crypto Academy
    Facebook X (Twitter) Instagram Telegram
    Crypto AcademyCrypto Academy
    Home»Price Analysis»Polygon (MATICUSD) Price May Break Out at $1.2394 Level
    Price Analysis

    Polygon (MATICUSD) Price May Break Out at $1.2394 Level

    Granit.MBy Granit.MAugust 6, 2021Updated:August 6, 20212 Mins Read
    Share
    Facebook Twitter LinkedIn Email Reddit Telegram WhatsApp

    Polygon (MATICUSD) Price Analysis – August 06

    A breakout at the resistance level of $1.2394 will increase the price to $1.8781 which may increase further to $2.2140. The breakdown at the support level of $0.8980 will decrease the price to $0.3194 and $0.2352.

    Key Levels:

    Resistance levels: $1.2394, $1.8781, $2.2140

    Support levels: $0.8980, $0.3194, $0.2352


    MATIC/USD Long-term Trend: Ranging

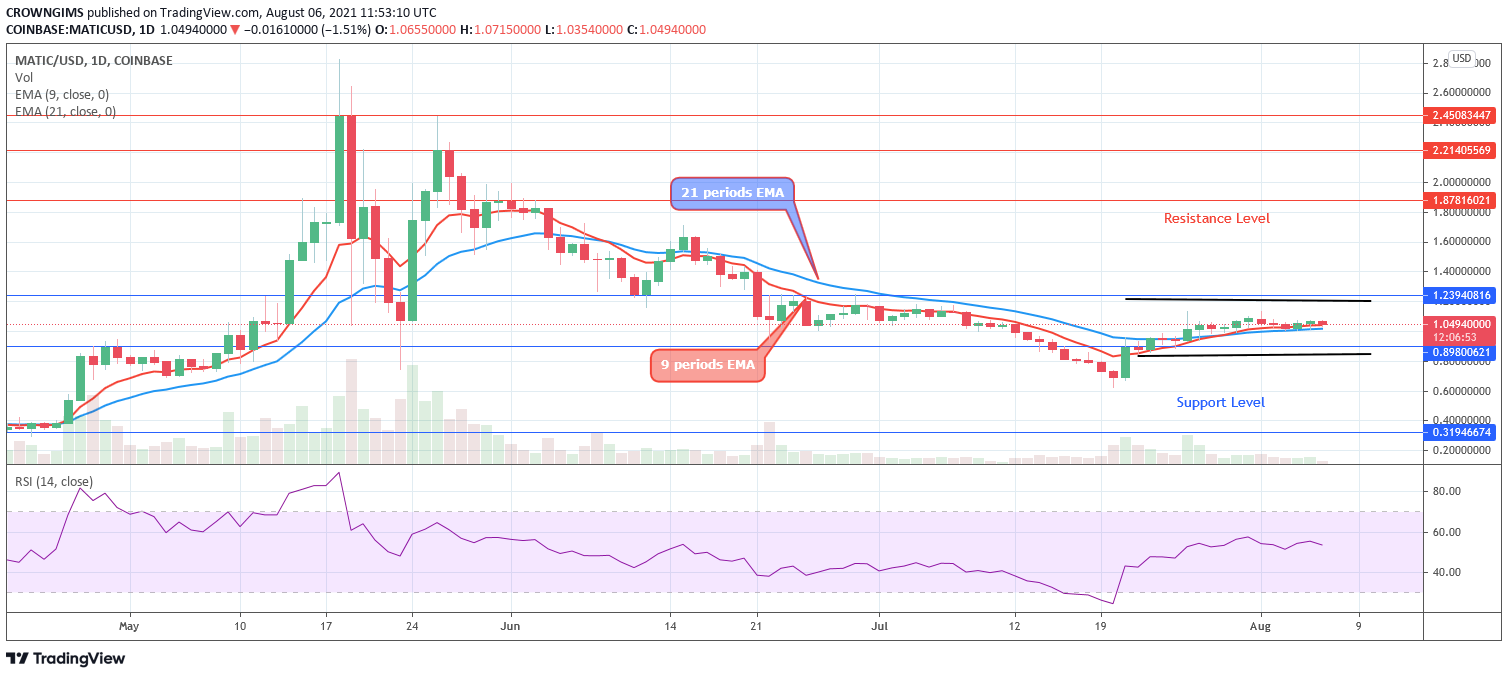
    MATIC/USD price is on the ranging trend on the Long-term outlook. The bears were in control of the Polygon market many days ago.  The bearish pressure pushed down the price and found support at $0.8980, the price pulled back and it is ranging between resistance level of $1.2394 and the support level of $0.8980.
    MATICUSD Daily chart, August 06

    The 9 periods EMA is interlocked with the 21 periods EMA which is an indication that the coin is on the ranging mode. A breakout at the resistance level of $1.2394 will increase the price to $1.8781 which may increase further to $2.2140. The breakdown at the support level of $0.8980 will decrease the price to $0.3194 and $0.2352. However, the relative strength index period 14 is at 50 level bending down to indicate sell signal.

    MATIC/USD Short-term Trend: Ranging

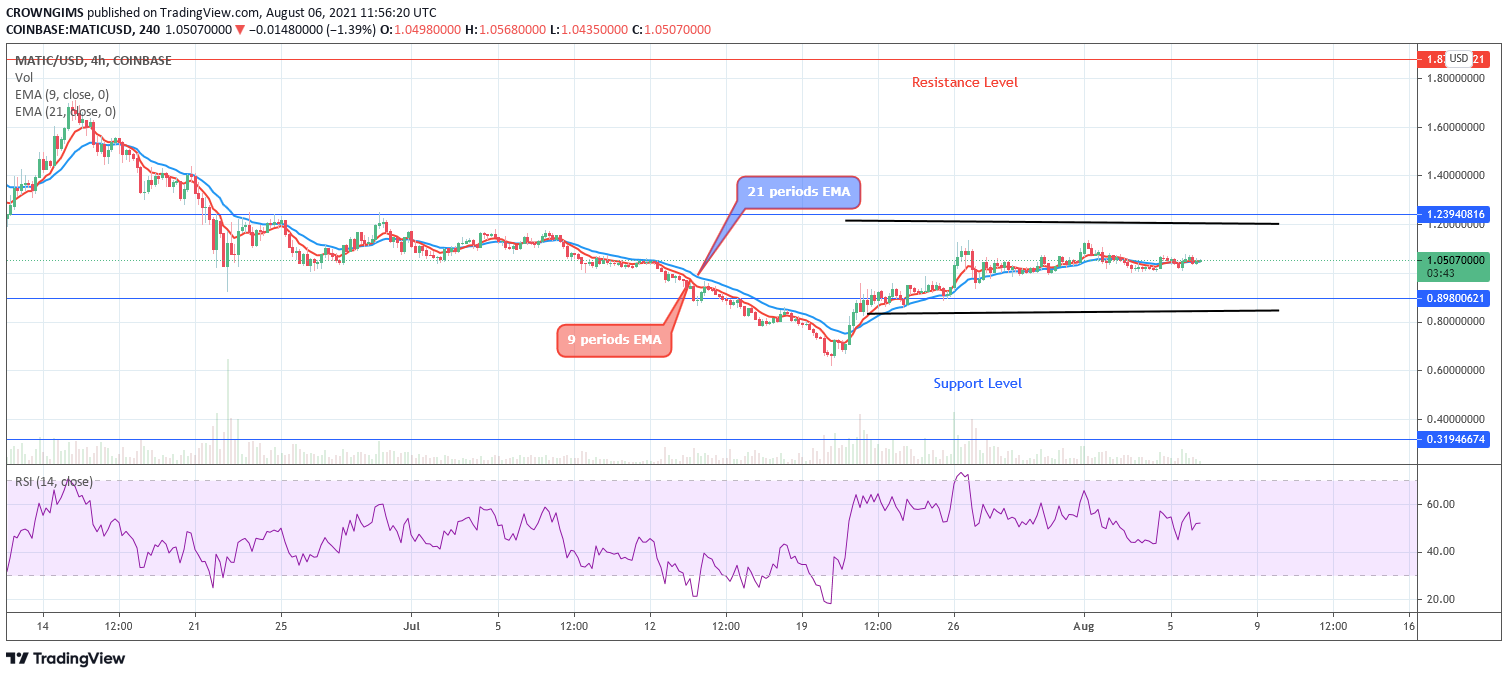
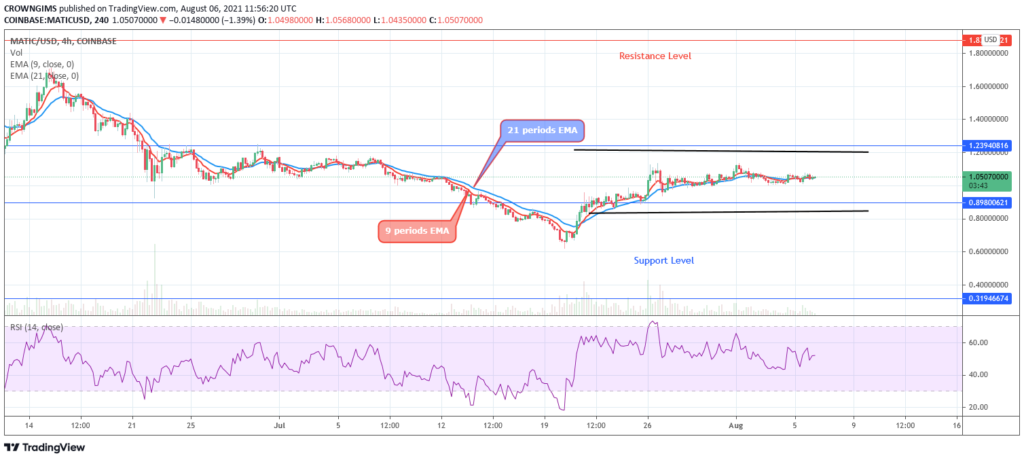
    Polygon is on the ranging movement on the medium-term outlook. The sellers have not got enough momentum to break down the support level at $0.8980. Likewise, the bulls have weak pressure and the resistance level of $1.2394 withstands the pressure of the buyers. The price continues ranging within the $1.2394 and $0.8990 price levels.
    MATICUSD 4 hours chart, August 06


    The 9-day EMA is interlocked with the 21 periods EMA and the Polygon price is hovering over the two EMAs which indicates a ranging trend. However, the relative strength index period 14 is at 40 levels with the signal line displaying no specific direction.
    Previous ArticlePolkadot (DOT) Pushes on Upside as Bulls Gain More Grounds
    Next Article Coinbase Review – What are the Pros and Cons of Coinbase?

    Related Posts

    XRP Surges Amid IPO Rumors

    Market Uncertainty to Impact Bitcoin (BTC) This Week

    Bitcoin (BTC) Could Bottom at Around $6,000 Before Reversing the Trend

    Crypto Gaming Tokens Bullish in Recent Weeks

    November 29, 2023

    Coinbase Shares Sold by Ark Invest

    November 29, 2023

    First Bitcoin Halving Event Happened 11 Years Ago Today

    November 29, 2023

    Arthur Hayes: The Rapid Expansion of Binance Led to the $4.3B Settlement

    November 29, 2023

    Cristiano Ronaldo Sued For Promoting Binance

    November 29, 2023
    Facebook X (Twitter) Instagram Telegram RSS
    • Home
    • Advertise on Crypto Academy
    • Terms and Conditions
    • Privacy Policy
    © 2023 Crypto-Academy.org. All rights reserved.

    Type above and press Enter to search. Press Esc to cancel.

    Go to mobile version