

Polygon (MATICUSD) Price Analysis – August 06
A breakout at the resistance level of $1.2394 will increase the price to $1.8781 which may increase further to $2.2140. The breakdown at the support level of $0.8980 will decrease the price to $0.3194 and $0.2352.
Key Levels:
Resistance levels: $1.2394, $1.8781, $2.2140
Support levels: $0.8980, $0.3194, $0.2352
MATIC/USD Long-term Trend: Ranging
MATIC/USD price is on the ranging trend on the Long-term outlook. The bears were in control of the Polygon market many days ago. The bearish pressure pushed down the price and found support at $0.8980, the price pulled back and it is ranging between resistance level of $1.2394 and the support level of $0.8980.

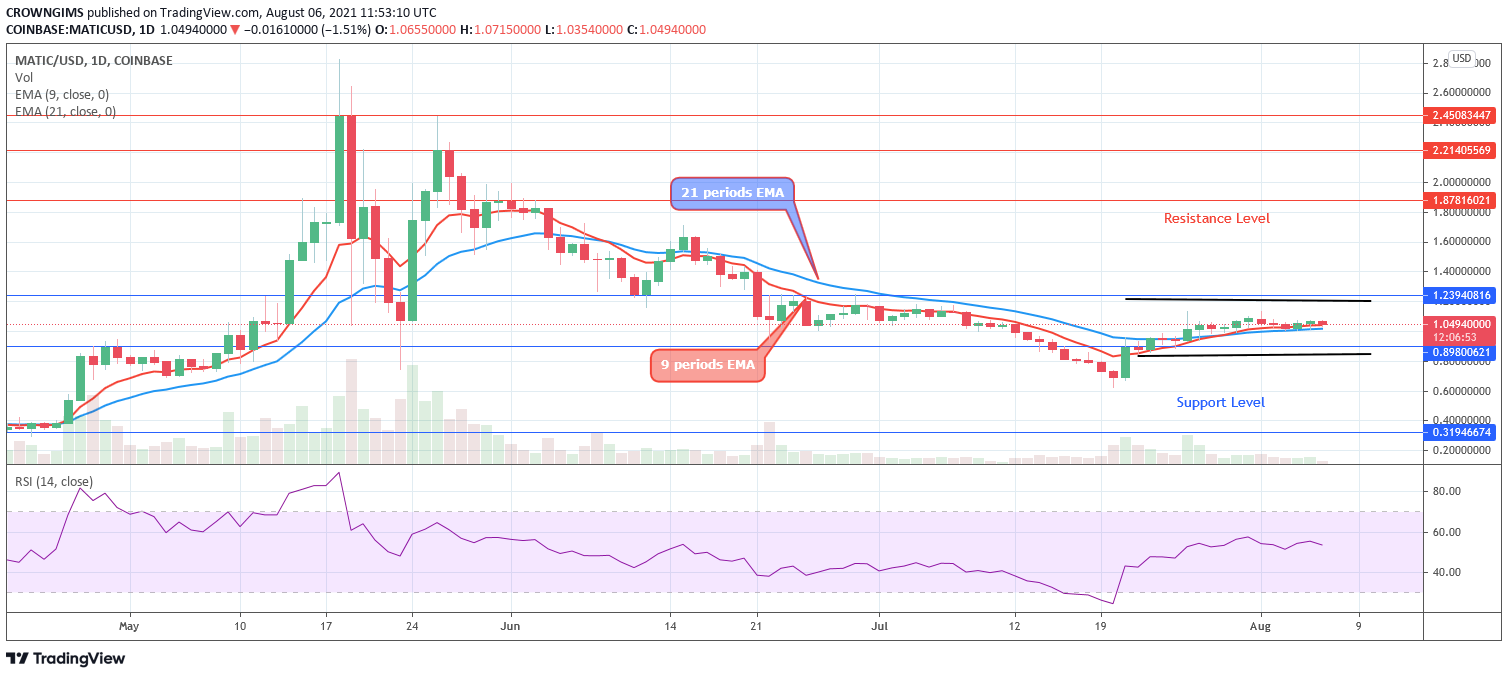
The 9 periods EMA is interlocked with the 21 periods EMA which is an indication that the coin is on the ranging mode. A breakout at the resistance level of $1.2394 will increase the price to $1.8781 which may increase further to $2.2140. The breakdown at the support level of $0.8980 will decrease the price to $0.3194 and $0.2352. However, the relative strength index period 14 is at 50 level bending down to indicate sell signal.
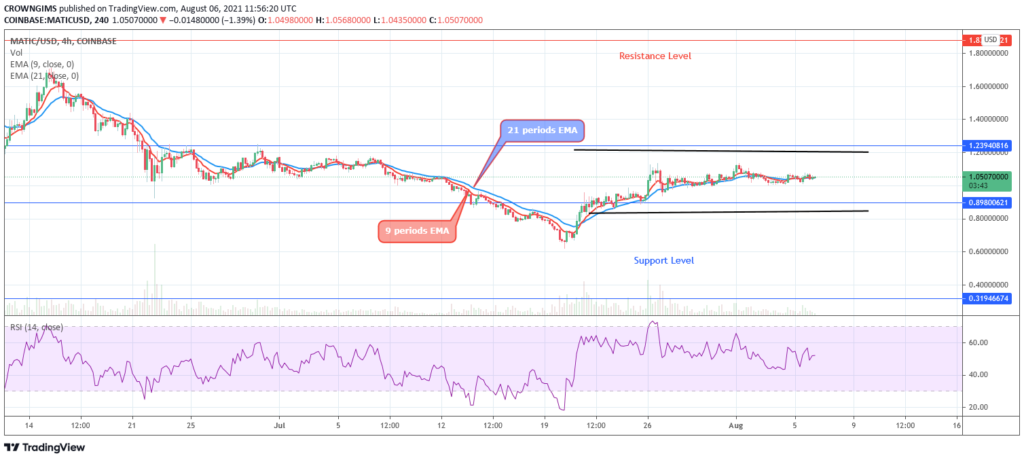
MATIC/USD Short-term Trend: Ranging
Polygon is on the ranging movement on the medium-term outlook. The sellers have not got enough momentum to break down the support level at $0.8980. Likewise, the bulls have weak pressure and the resistance level of $1.2394 withstands the pressure of the buyers. The price continues ranging within the $1.2394 and $0.8990 price levels.
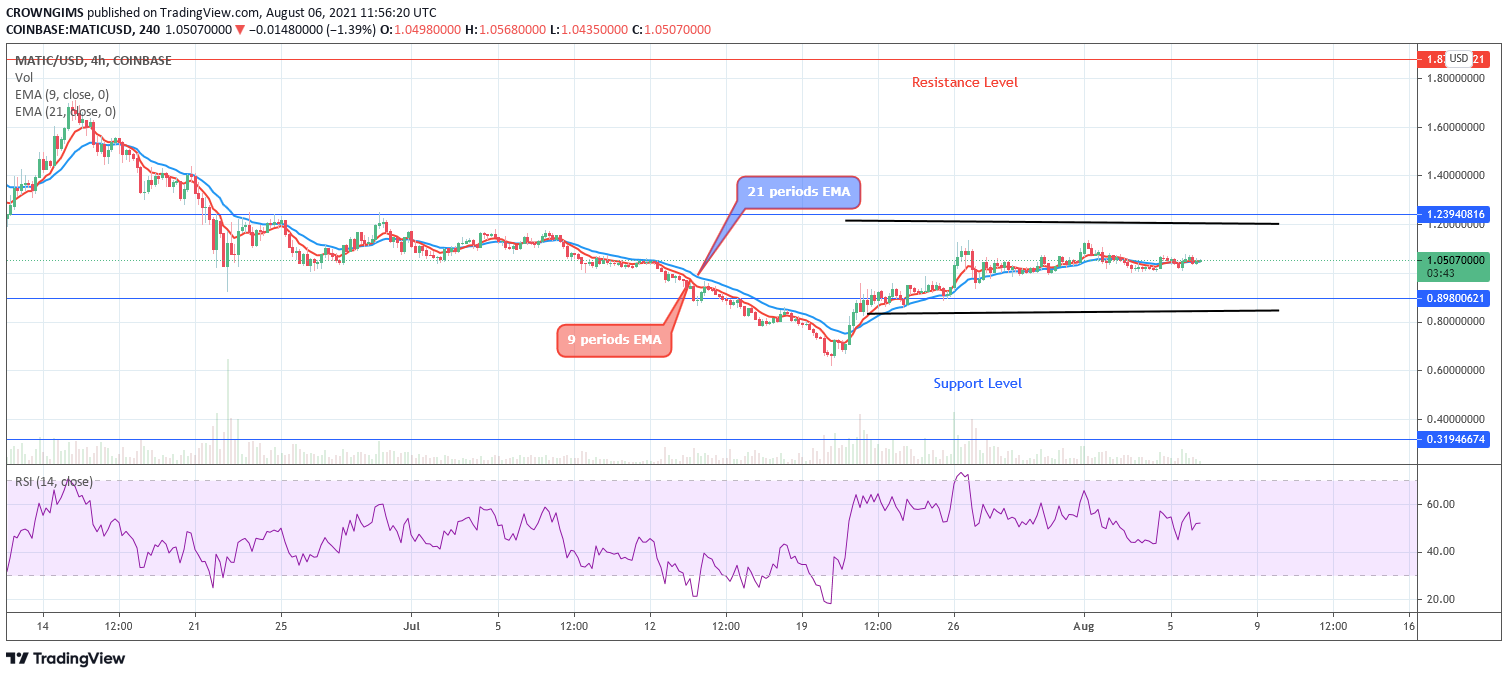
The 9-day EMA is interlocked with the 21 periods EMA and the Polygon price is hovering over the two EMAs which indicates a ranging trend. However, the relative strength index period 14 is at 40 levels with the signal line displaying no specific direction.