

Near Protocol is a fast and reliable solution incepted to provide a faster and better environment as well as dApp development. Our Near Protocol price analysis explores the current price movement in a bullish market. Near Protocol is promoting to be a new, better than Ethereum way to deploy decentralized applications.
NEAR price reached the year-to-date (YTD) high on the 17th of January 2022, following the price movement of the top-tier cryptocurrencies such as Bitcoin, Ethereum, and others. The price fell down in the following month only to regain the second YTD movement on the 8th of April, 2022.
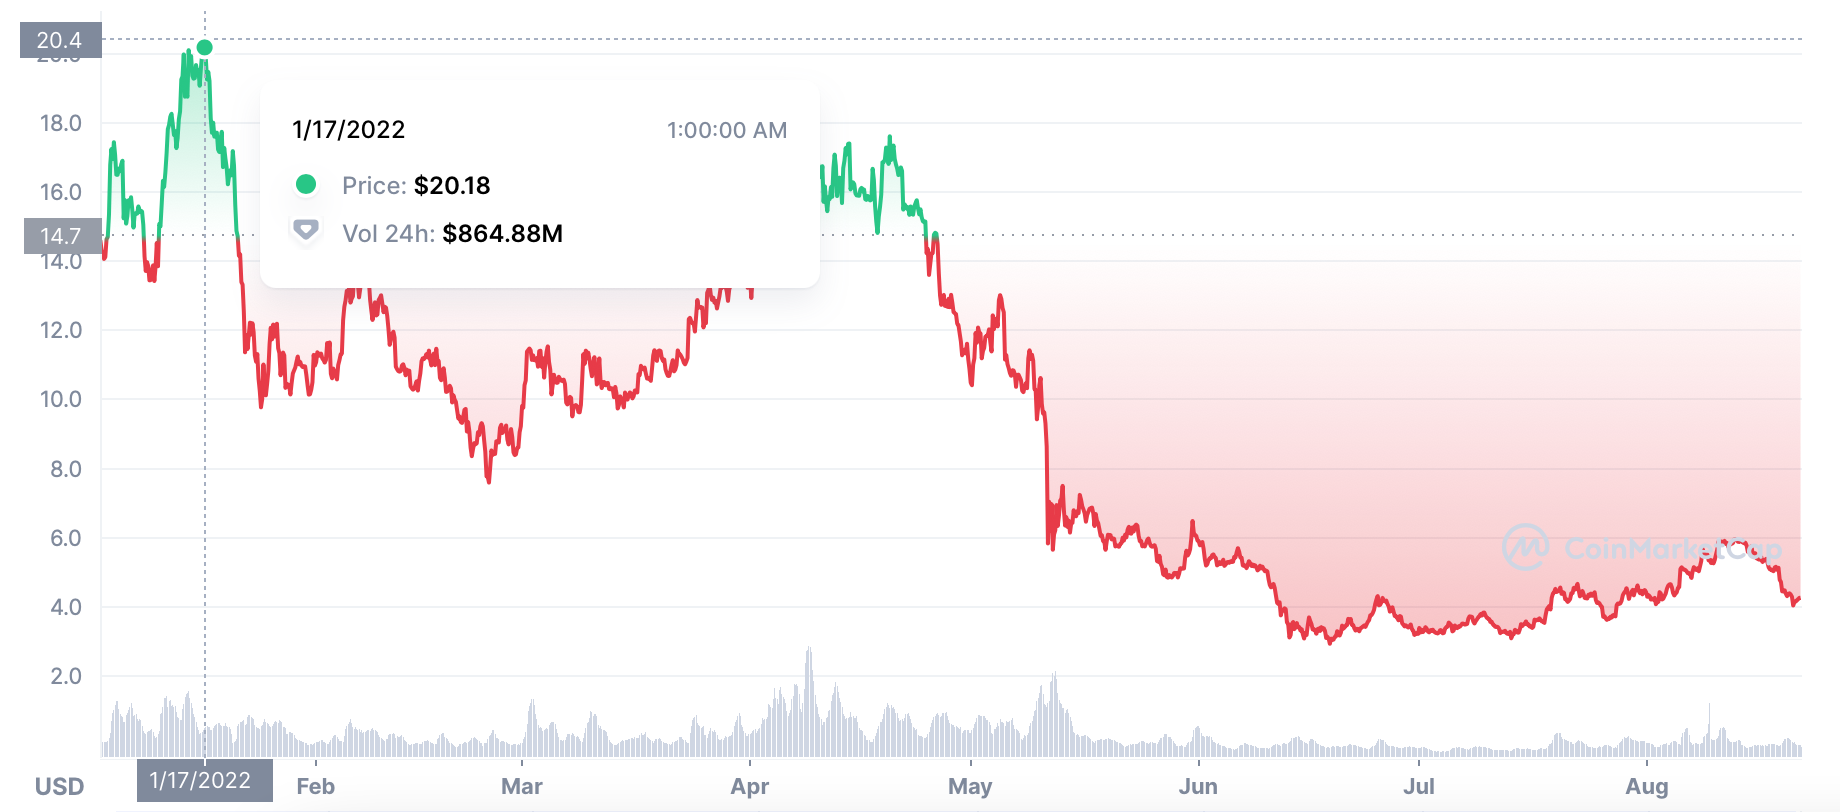
Near Protocol price chart by CoinMarketCap

In May 2022, the NEAR price saw a flash drop to the $6 level, only to drop further in the months to come. The YTD low was observed on the 19th of June, 2022, when the price fell down to $3.05. Near Protocol finally managed to break past the $6 mark in August 2022; however, at the time of writing, it is only recovering back towards the mark.
Near Protocol Price Analysis: NEAR price rising after a overselling streak
Near Protocol price analysis reveals that the token enjoyed the highs while the market was climbing near the 14th of August, 2022. The monthly high came around the same time when the price touched the $6 mark twice after months; however, it was unable to maintain.
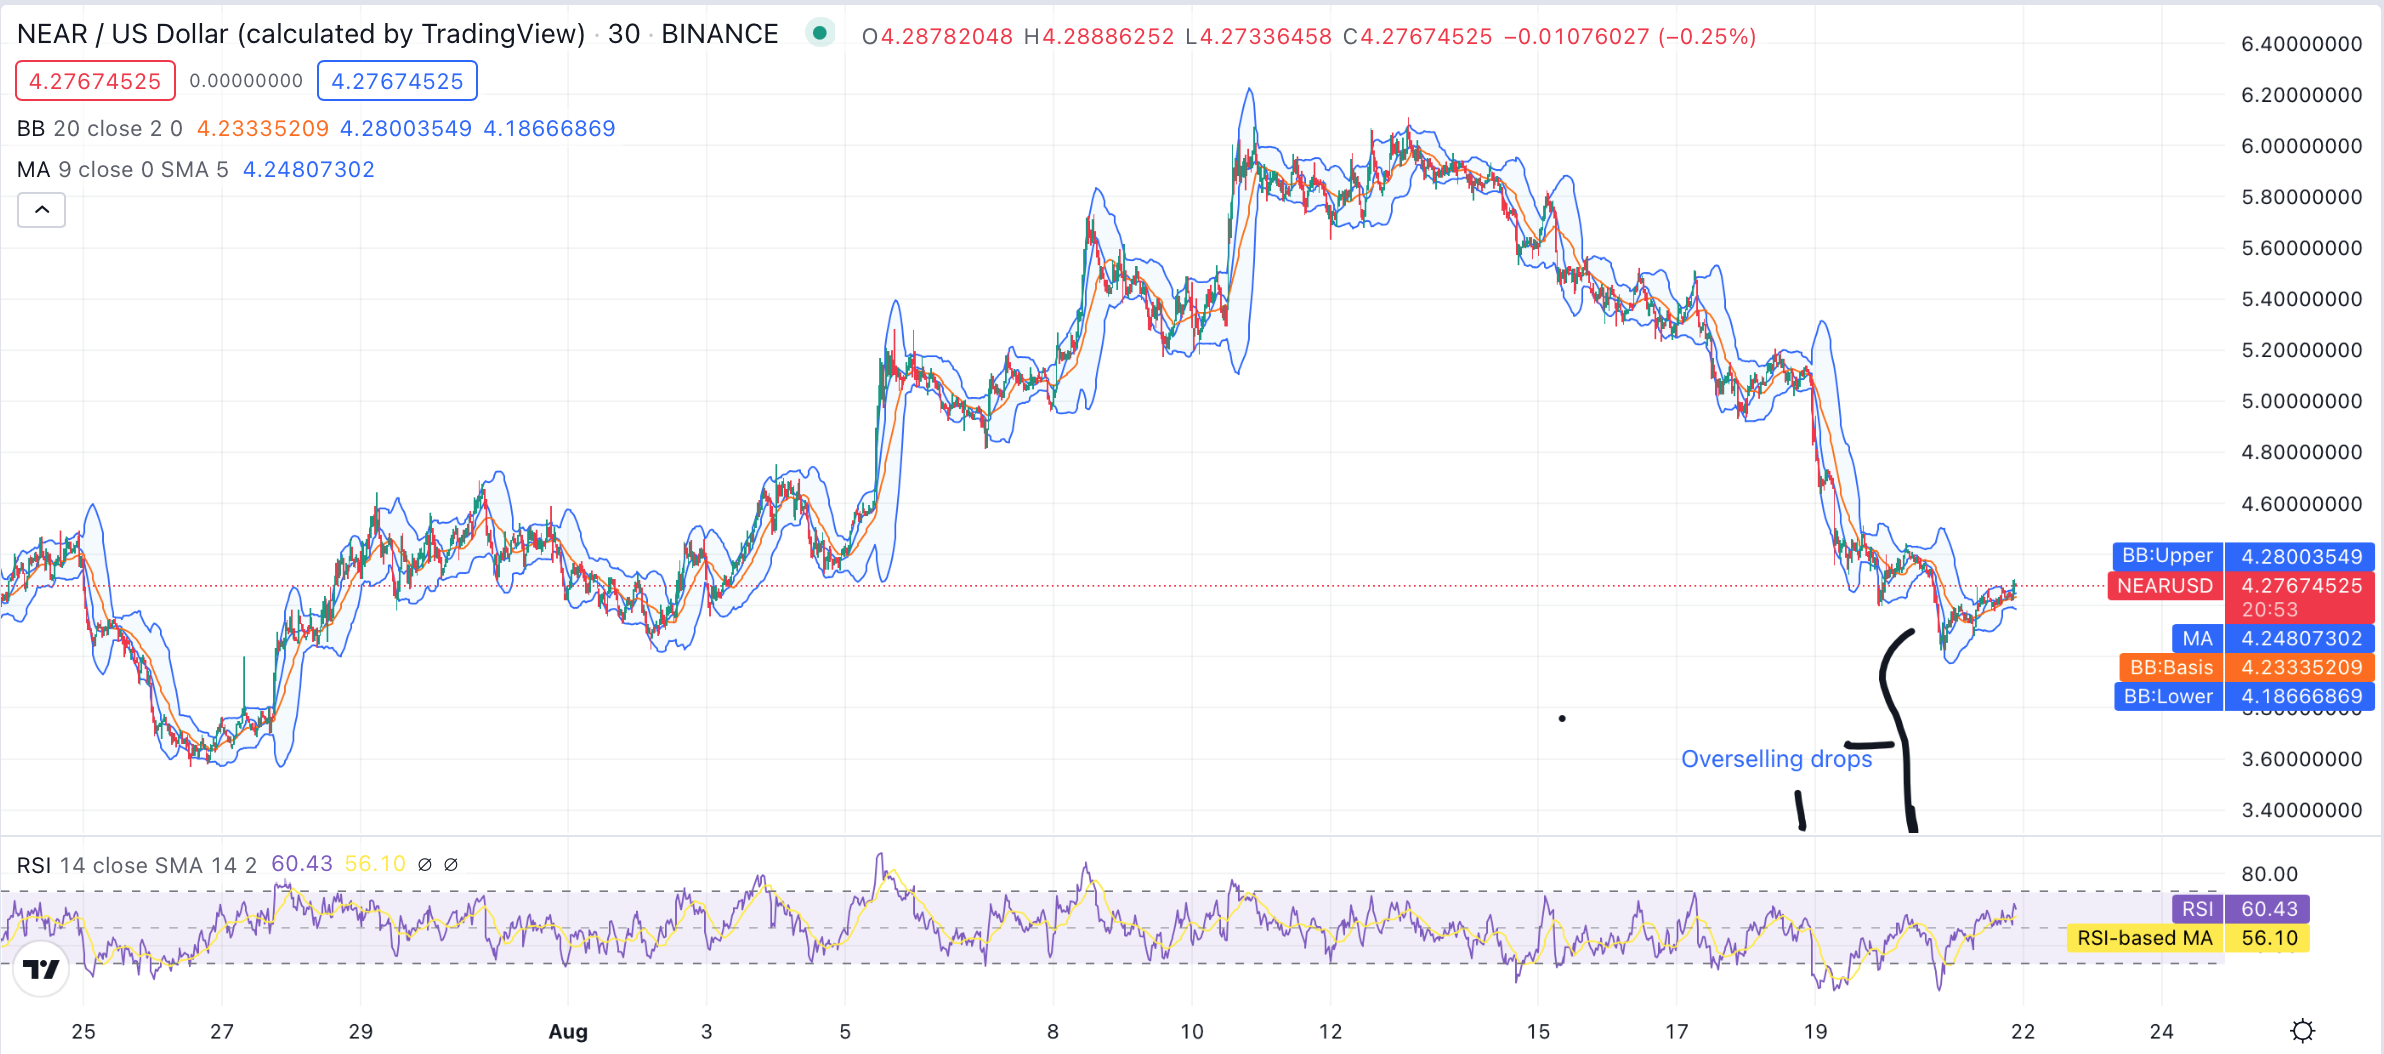
Near Protocol price analysis chart made with TradingView

On the 17th and 18th of August, 2022, the price fell back down to the $5 range, while the next drop came on the 19th of August when a huge overselling streak hit the market. The most recent price drop from $4.36 to the current price was also owed to another overselling streak.
Since the overselling streak, the relative strength index (RSI) score is traveling in a smooth motion, almost leaning towards overbuying. The current RSI score is 60.43, while the RSI moving average stands at the 56.10 level.
At the time of writing, Near Protocol price stands at the $4.27 mark going through a bullish momentum. The only resistance that keeps on dropping to support while writing is posed by the Bollinger Bands upper limit mark found at the $4.28 mark.
NEAR price has strong support at the time of writing, priming it for a rise in price very soon. The first support level comes at the moving average (MA) mark found at the $4.248 level. The next support point is found with the Bollinger Bands average (BB: Basis) at the $4.23 mark. While the strongest support is found at the $4.186 mark.
The current market NEAR price movement shows promising support both on the price movement chart and the buying/selling trend chart. It appears that traders, after making a profit on the recent rise, are now moving into a more stable buy/sell trend keeping the price stable and the momentum bullish.
However, if the current support levels give way in case of another selling streak, the price can fall down to the 27th of July level of $3.6. Traders are advised to keep an eye on the buy/sell trend before making any investment decisions based on the current rise in the prices or the current support levels.
TakeAways
- Near Protocol is moving in a bullish momentum and is like to gain.
- Near Protocol price saw an overselling streak dropping to the lows.
- A buying streak managed to pull the price up to the current levels.
- NEAR price is primed for stable movement.
- Another selling streak can cause the market to fluctuate and the price to drop.
Disclaimer: The information provided on this page is most accurate to the best of our knowledge; however, subject to change due to various market factors. Crypto-Academy encourages our readers to learn more about market factors and risks involved before making investment decisions.