


DGB Technical Analysis – October 2021
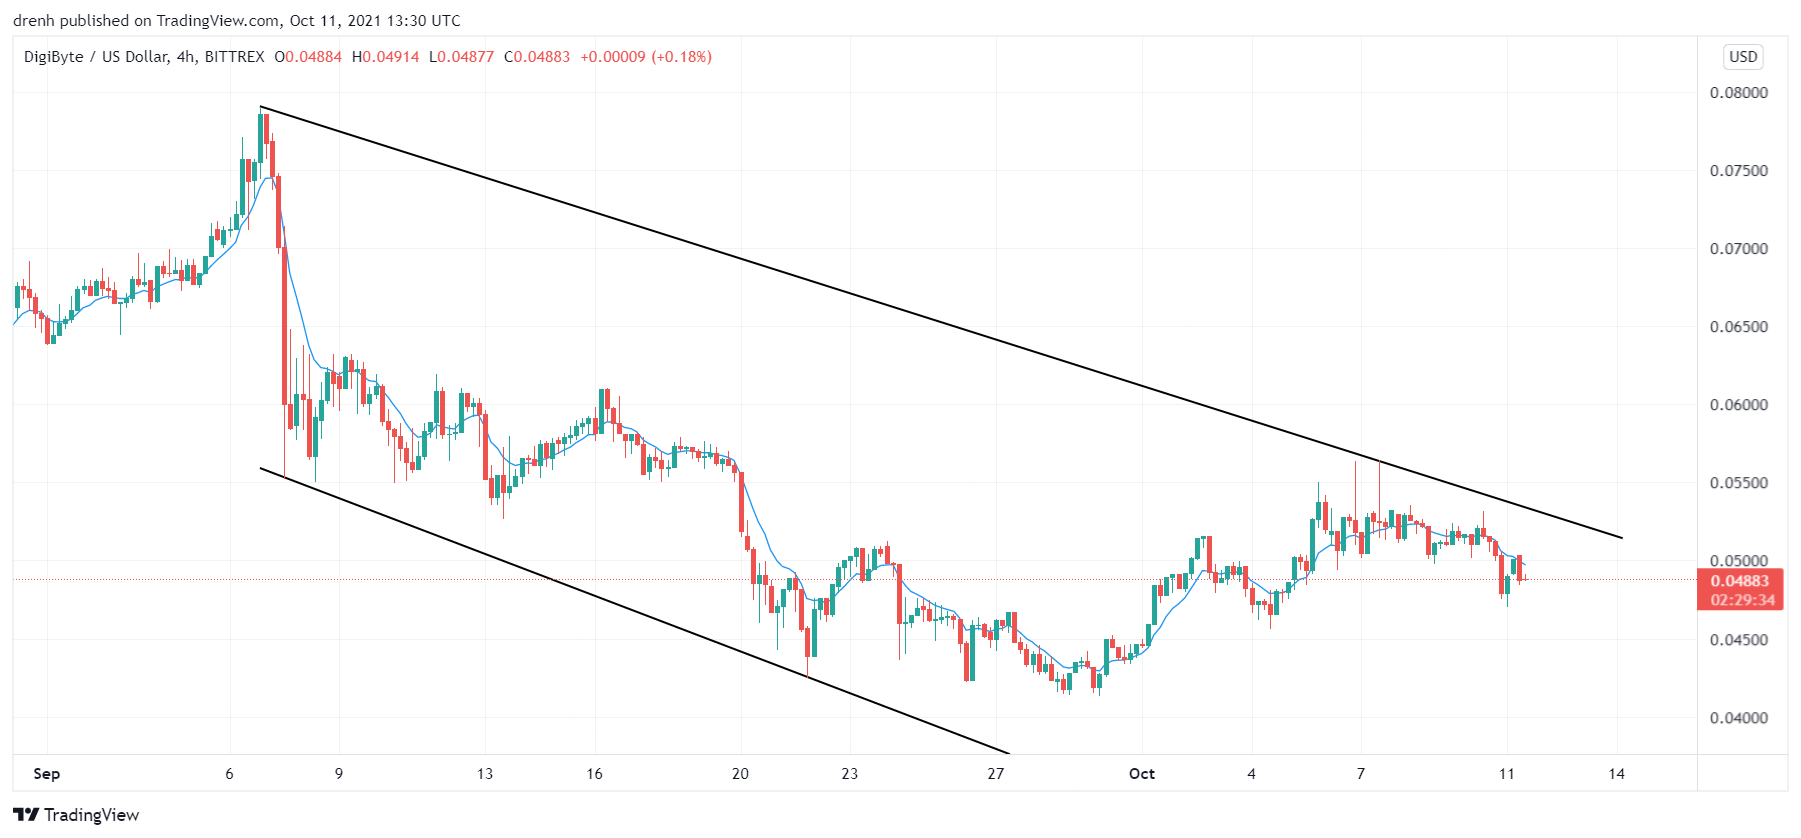
Monthly Analysis
Over the last 30 days, DGB has decreased by 33%. Then, the price found support at $0.041. Shortly after that, the trend reversed as the price started increasing. The newer highs and lows were higher than the previous ones. The price has increased by 37%.

Weekly Analysis
In the last 7 days, DGB has decreased by 16%. This indicates that the trend of the shorter run is bearish and that the price could keep decreasing in the coming days of this week.
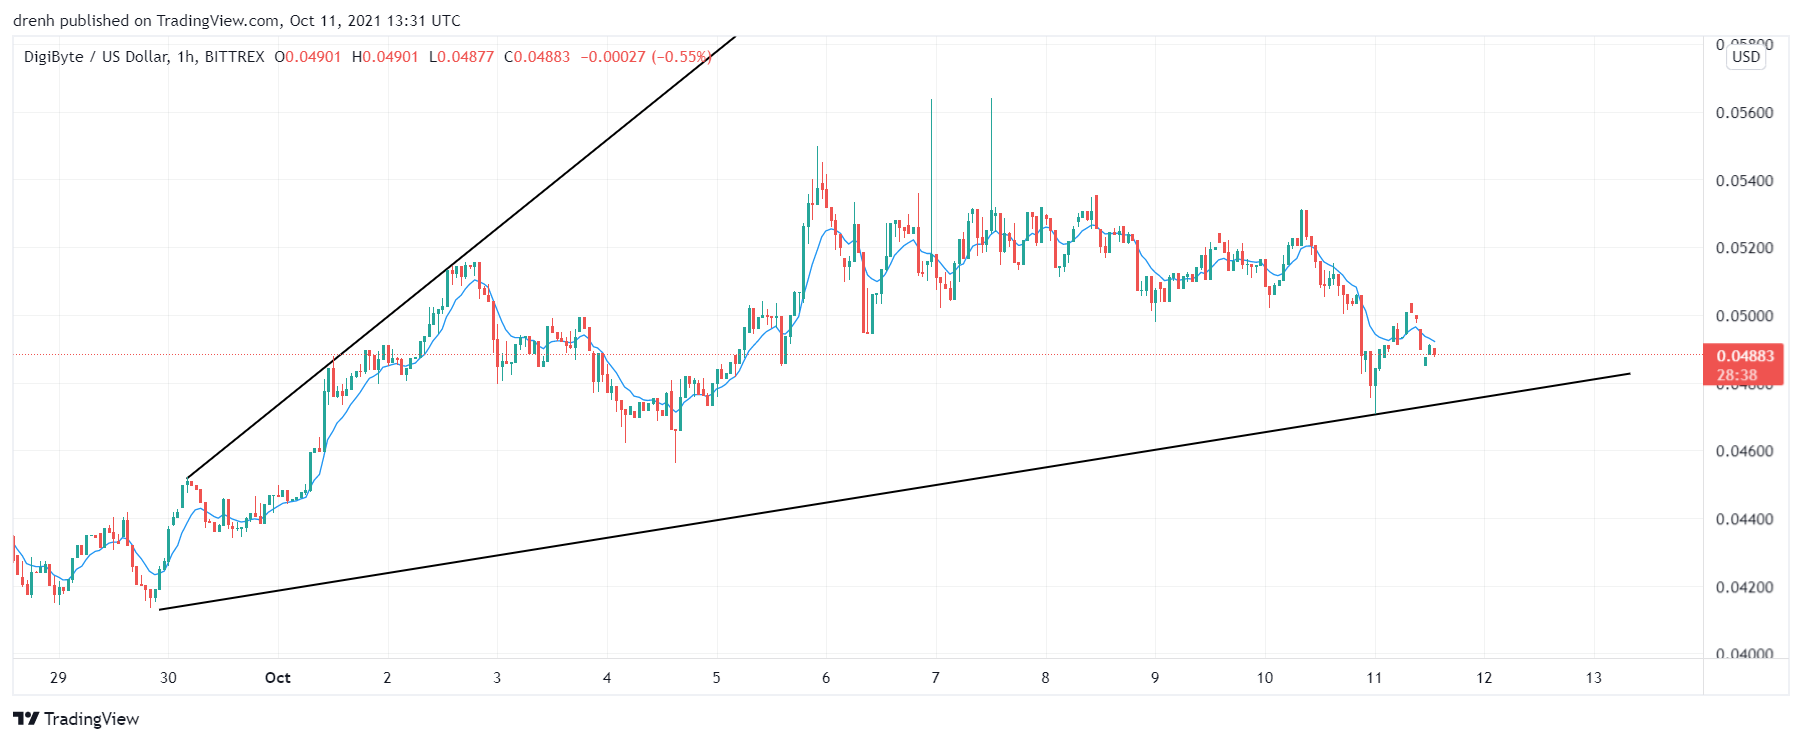

Daily Analysis
In the intraday chart, the price of DGB has been volatile. It has increased by 7% in the last few hours, meaning that the price could keep increasing in the coming hours.
Key Structures
Support
- $0.04
Resistance
- $0.06
Indicators
Moving Average
The 2-day moving average is close to the price and is currently supporting DGB. This indicates that the coming days may indicate whether the trend can be bullish or bearish for DGB.
The 9-day EMA is slightly above the price and may act as resistance for DGB. This indicates that DGB could keep decreasing in the shorter run.
Relative Strength Index
The RSI of a daily chart is slightly below 50, indicating that the momentum is bearish and that the price of DGB could keep decreasing. In a 4-hour chart, the RSI is even more bearish, meaning that the price could decrease in the coming hours as well.
MACD
The MACD line is above the signal line and heading above the baseline in a daily chart. This indicates that the momentum is bullish and that the price could keep increasing in the coming days. The opposite applies to the 4-hour chart as the MACD line is quite below the signal line.
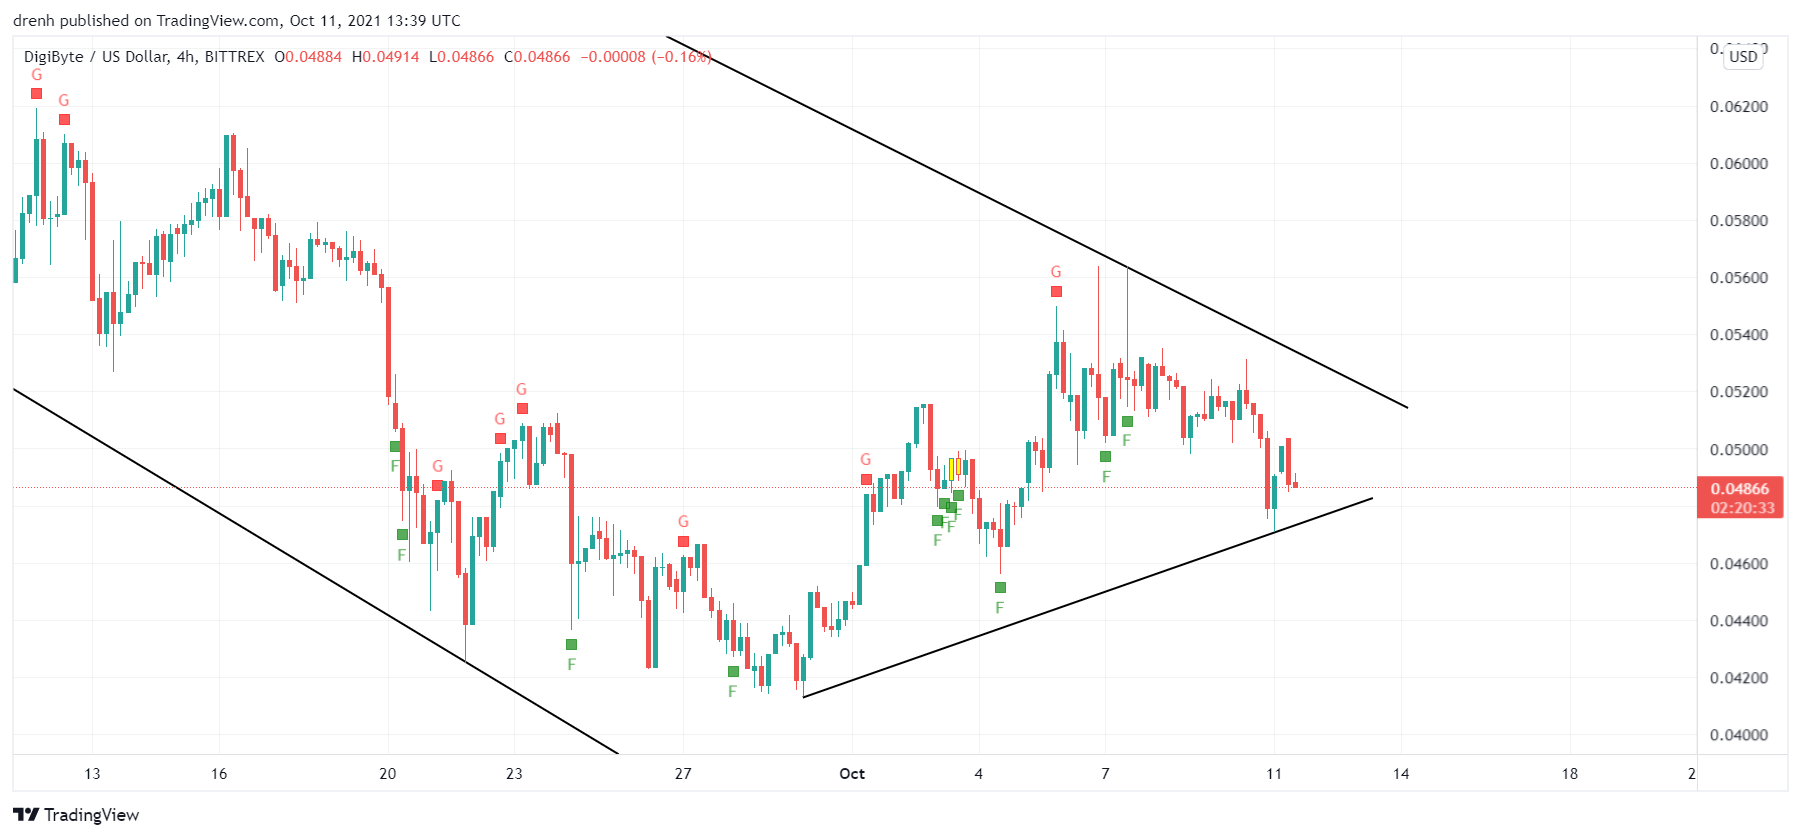
Fear & Greed
The fear and greed indicator in a 4-hour chart suggests that the current emotion of DGB traders is fear, which translates to bearish tendencies.
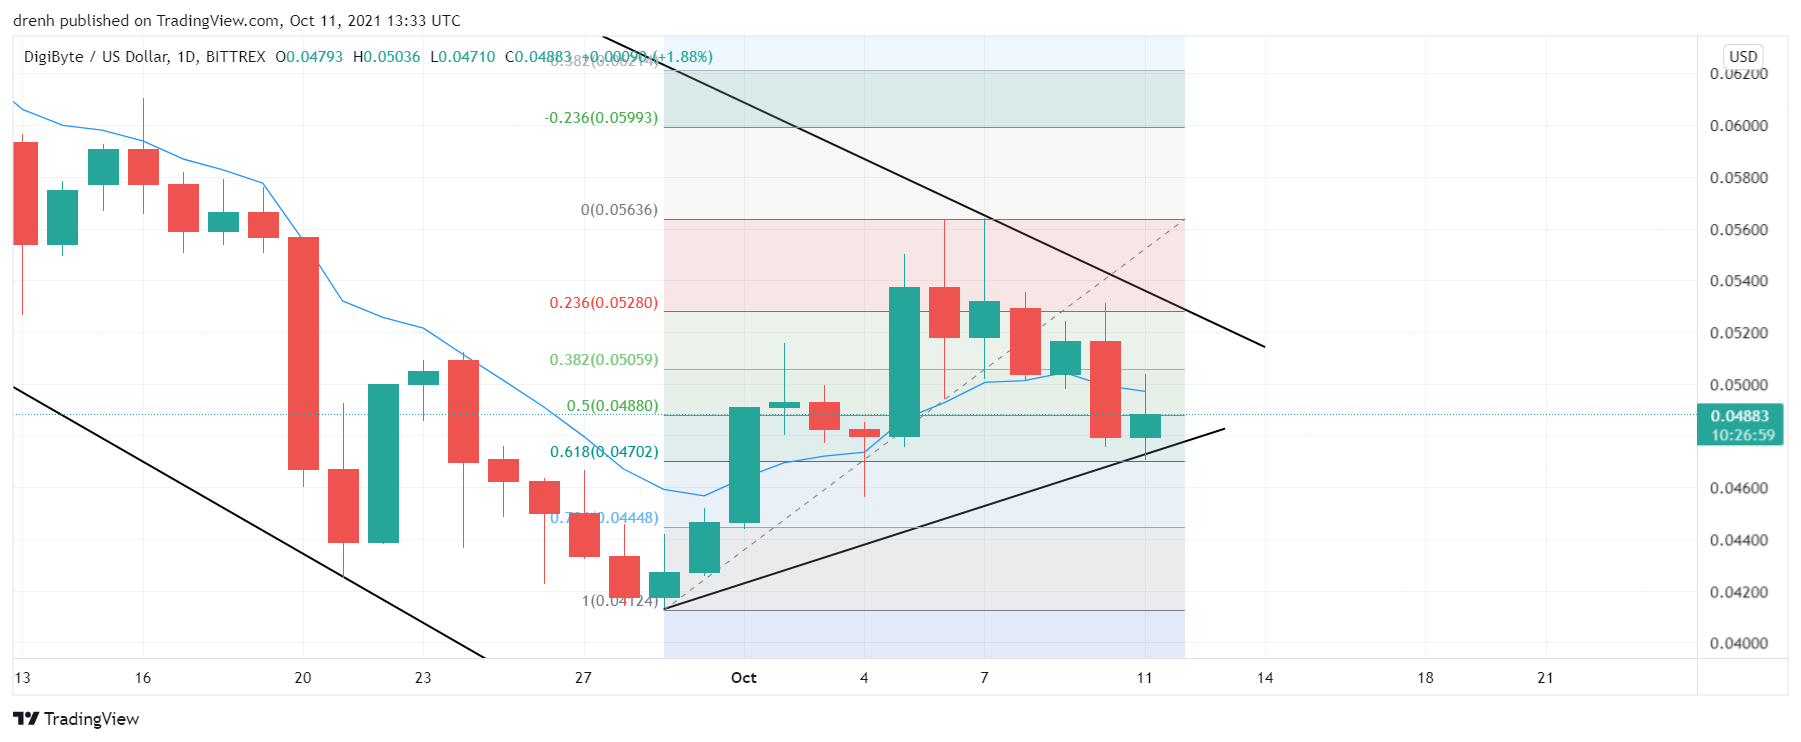
Fibonacci
The Fibonacci retracement levels of the recent downtrend suggest that DGB has recently retraced to the 38.2% level, meaning that the price could go further down in the coming days.
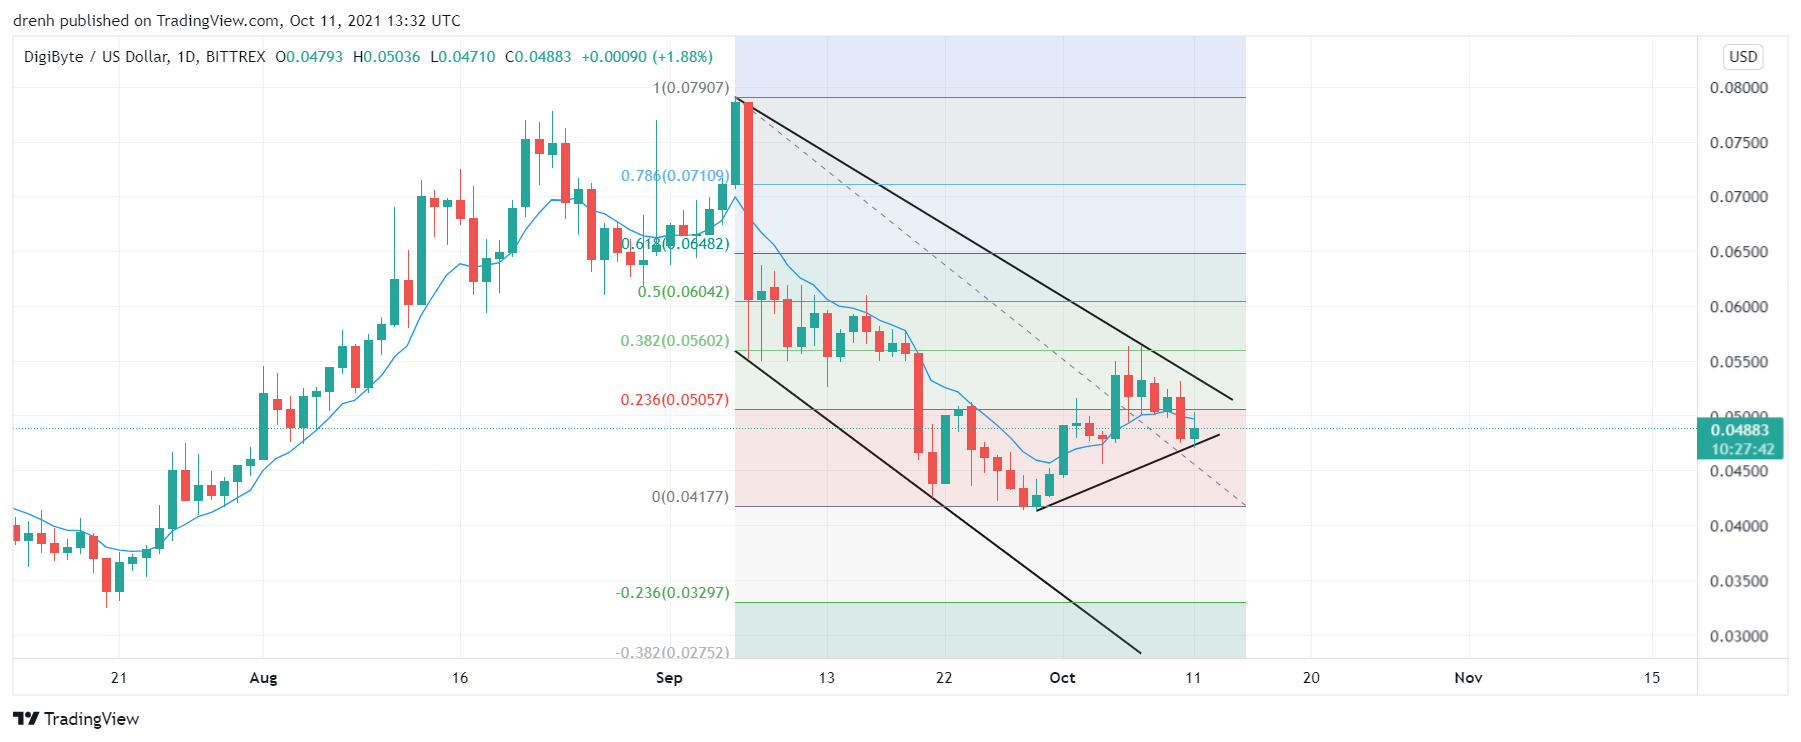

As for the more recent price movement, where the price has increased, Fibonacci levels suggest that DGB has retraced to the 61.8% level. This could see DGB aim for the 23.6% extension level in the shorter run.
Price Prediction DGB – October 2021
Based on this technical analysis on DGB, we could see its price keep increasing in the coming days if BTC maintains its bullish nature. If that occurs and DGB breaks the projected resistance, then its price could soar upwards and even break its all-time high. However, the selling pressure is still high for DGB as the longer-term trend is bearish, indicating that the price could decrease.
Latest News for DGB – Affecting Price
There has not been any major news for DigiByte. However, there has been speculation that the DigiByte ecosystem might focus more on NFTs in the coming months. This can greatly affect the price of DGB.
Also read: Digibyte Price Prediction 2021 and Beyond – Is DGB a Good Investment?