

DGB Technical Analysis – November 2021
Monthly Analysis
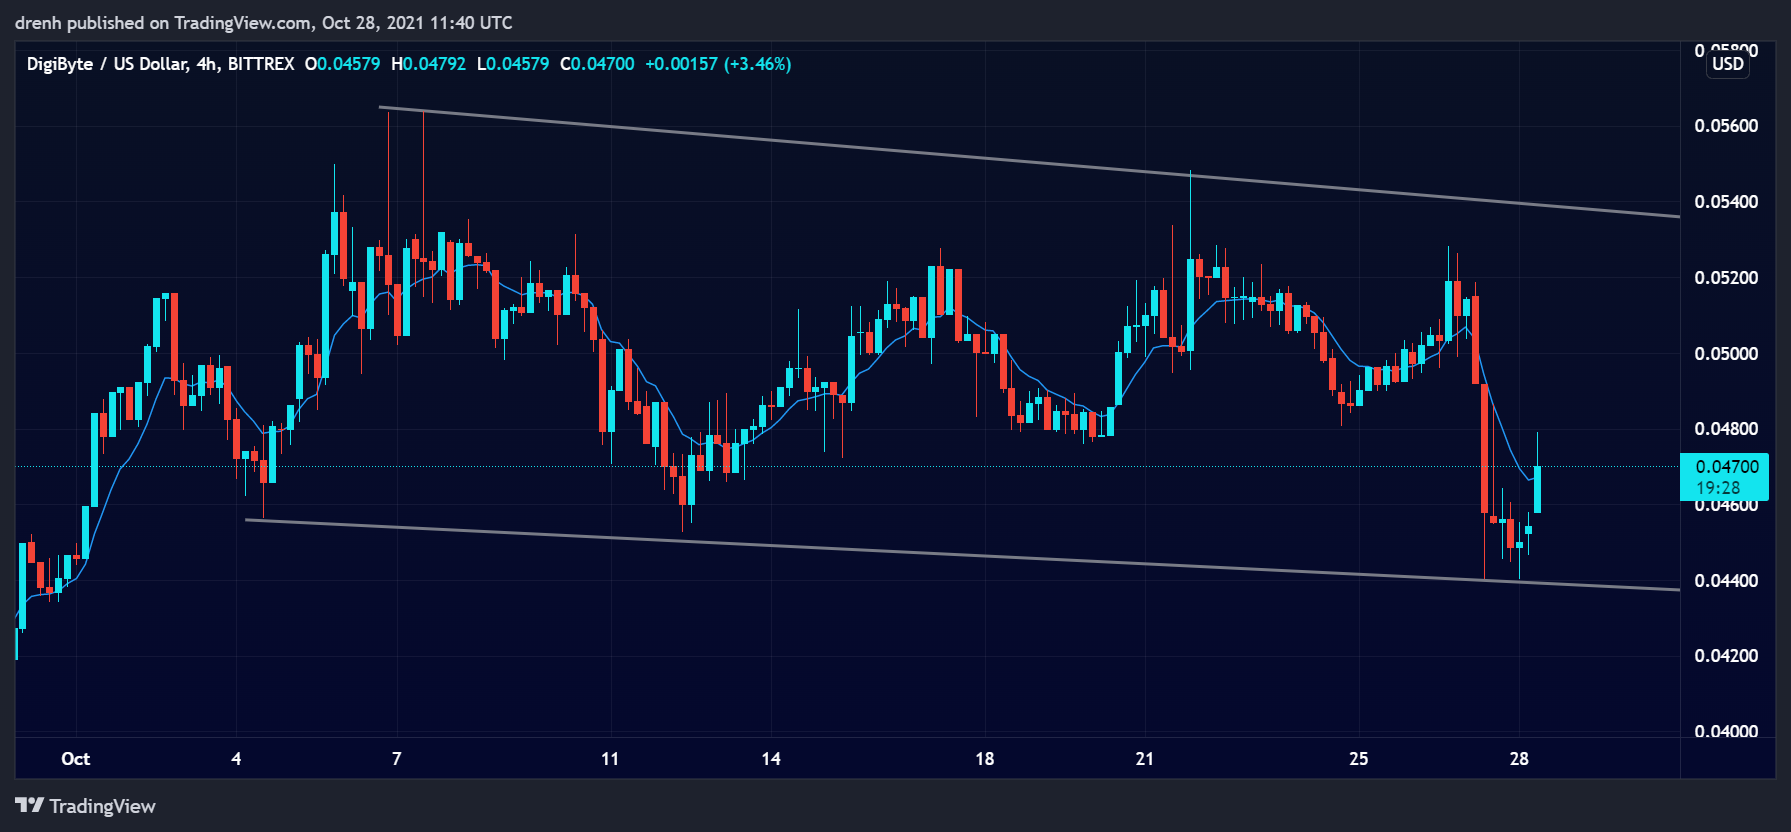
In the last 30 days, DGB increased by around 46%. This increase was then stopped at resistance at $0.056. After that, the price of DGB has been on the fall as the trend line is facing downward.

Weekly Analysis
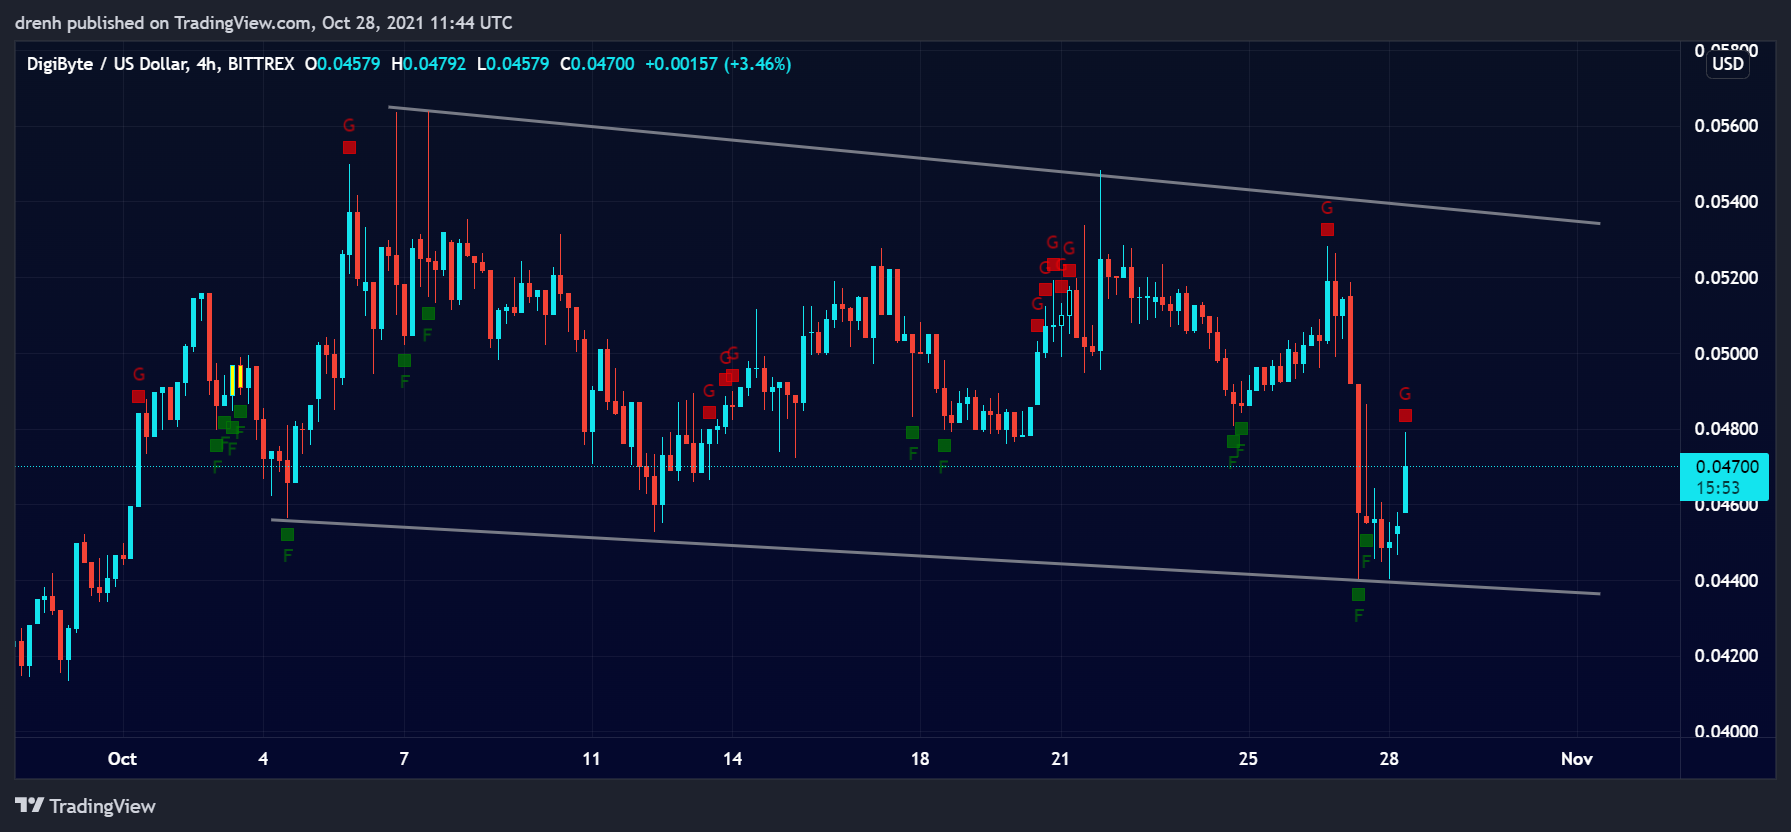
Over the last 7 days, DGB has declined by 19%, meaning that the trend could be bearish. The trend is consolidation, and the price of DG could increase up to the upper line of the channel once again.
Daily Analysis
In the intraday chart, DGB has been highly volatile, as the price has increased and decreased by 6% in a 30-minute chart. The price is in consolidation, but the trend is upward.
Key Structures
Support
- $0.044
Resistance
- $0.052
Indicators
Moving Average
The 20-day moving average is now above the price, indicating that the trend of DGB is now downward and that the price can keep declining in the coming days.
The 9-day EMA is also above the price due to the recent dip in the price, and it is currently acting as resistance to the price of DGb if it attempts to increase in the short run.
Relative Strength Index
The RSI of a 1-day chart is slightly bearish and has not shown an increase in activity recently, indicating that the selling pressure remains slightly higher for DGB. the same applies to a 4-hour chart
MACD
In a 1-day chart, the MACD line is below the signal line, indicating that the momentum is bearish and that the price of DGB might decrease in the coming days. In a 4-hour chart, the MACD line is above the signal line, meaning that the momentum is bullish for the shorter term.
Fear & Greed
The fear and greed indicator of a 4-hour chart suggests that the current emotion of DGB traders is greed due to the recent correction.
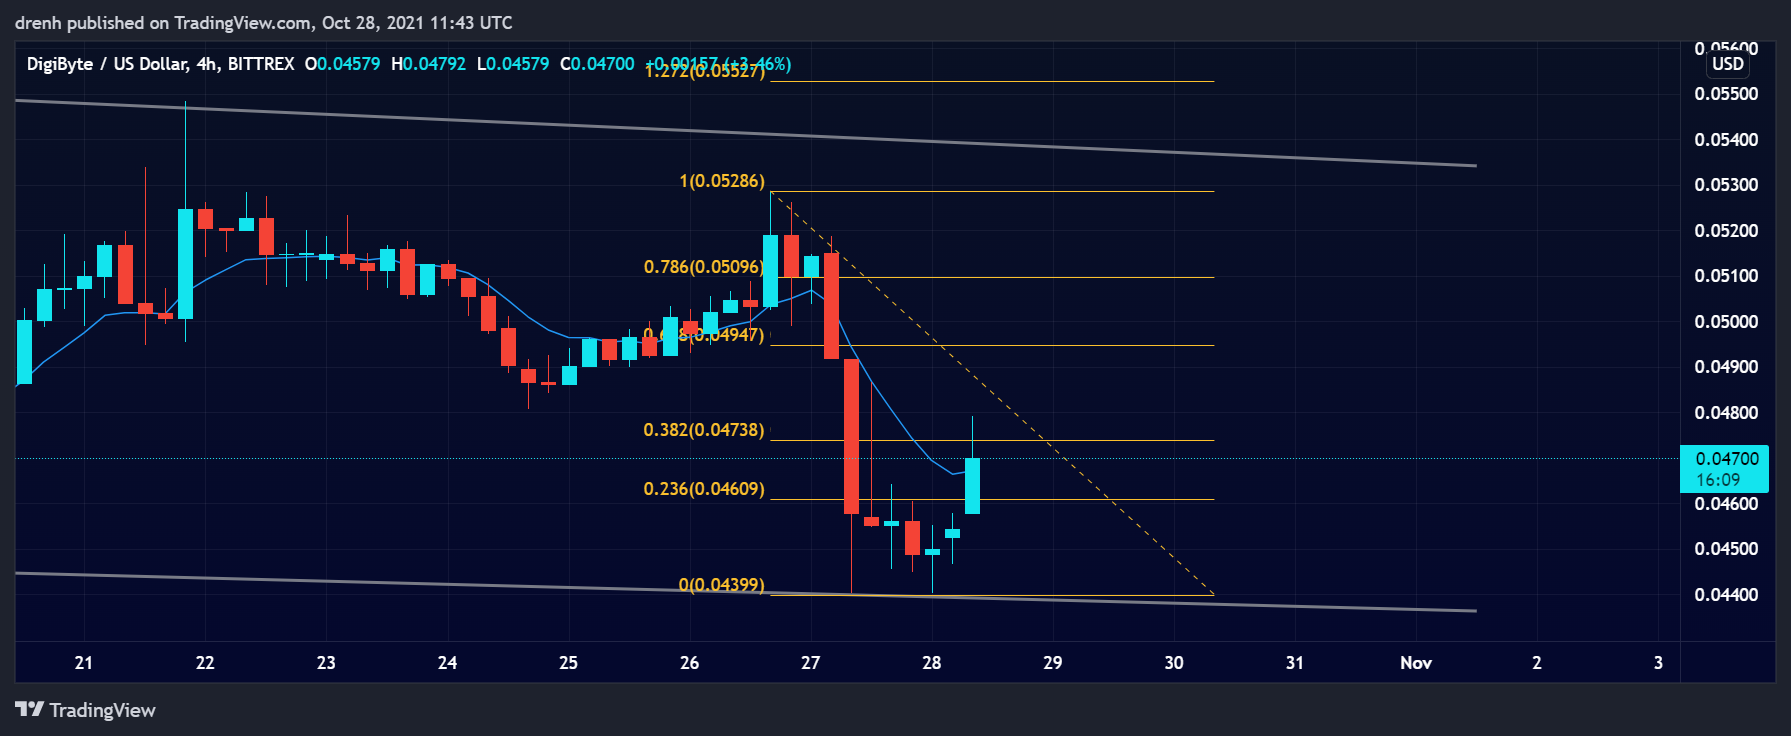
Fibonacci
The Fibonacci retracement levels suggest that the price of DGB could retrace to the 61.8% level in the coming hours. If DGB hits resistance there, then its price may further decline.

Price Prediction DGB – November 2021
Based on this technical analysis on DigiByte (DGB), we could see its price increase and retest resistance levels in the coming days. If DGB fails to break resistance then its price could go even lower. However, since BTC is increasing and the bull cycle is not over yet, we could expect DGB to soon have a surge upwards and aim for a new all-time high. A price of $0.50 is possible in the longer run.
Latest News for DGB – Affecting Price
There has not been any major news regarding DigiByte, but there has been plenty of activity in the market. Various cryptocurrencies have surged upwards recently, and DGB could join that wave soon as well. Because of the fear of missing out, we could see the price of DGB increase in the coming weeks.
Also read: Digibyte Price Prediction 2021 and Beyond – Is DGB a Good Investment?