


DGB Technical Analysis – September 2021
Monthly Analysis
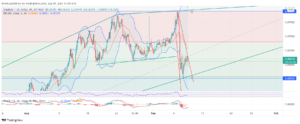
Over the last 30 days, DGB has increased by 50%, reaching as high as $0.078. After that, the price declined to $0.055, where it also found support. This support level can be crucial in the upcoming days for DGB.

Weekly Analysis
On a weekly basis, DGB increased by more than 20%, but then it was followed by a decrease of 30%. Based on this, the short-term trend for DGB is bearish.
Daily Analysis
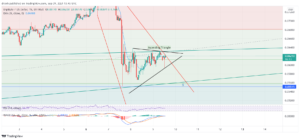
In the intraday chart, we can notice that the recent price correction has formed an ascending triangle pattern. Such a pattern indicates bullish tendencies in the shorter term. Due to this pattern, a bullish breakout might occur for DGB in the coming hours.

Key Structures
Support
- $0.055
Resistance
- $0.079
Indicators
Moving Average
The 20-day moving average has jumped over the price due to the recent price decline. This indicates that the trend is now downwards and that DGB can keep decreasing. The 50-day MA suggests that the price is still bullish in the longer run, where the MA line might act as support.
The 9-day EMA also shows that the trend is now descending and the EMA line might act as resistance in the coming days.
Relative Strength Index
The RSI of a daily chart is fairly average at around 50. It declined after hitting 70, which also indicated that DGB became overbought and that traders should have sold their DGB tokens. The current RSI indicates that DGB can now go either way, but due to the recent correction, traders might also move this RSI higher again.
MACD
The MACD of a daily chart is below the signal line and headed below the baseline. This shows that the momentum is bearish for DGB.
Fibonacci
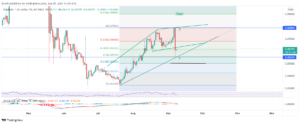
The Fibonacci levels of the uptrend that started in July indicate that the 61.8% level is yet to be reached, and it may be a good level of support. If the price finds support there, then DGB can aim for $0.09 in the longer run.

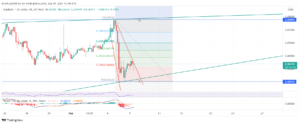
If we look at the Fibonacci levels at the recent downtrend, we can see that the price might correct up to $0.064, where the 38.2% level resides. Also, 61.8% could be a strong structure of resistance.

Price Prediction DigiByte – September 2021
Since the longer-term trend is still ascending, we might see the price of DigiByte have a consolidation or even go lower at first, but then it may go upwards again close to $0.09. However, if DGB fails to find support at the projected structures, then the long-term trend might be bearish. That is if DGB goes below $0.05.
Latest News for DigiByte – Affecting Price
DigiByte plans to include a metaverse through NFTs in the coming days. While this is yet to be confirmed, such an addition could easily increase the price of DGB since NFTs are one of the hottest assets of 2021. DGB remains one of the most trusted and oldest cryptocurrency networks in the world, so such updates could further increase its reputation.
Also read: Siacoin Price Prediction September 2021: SC Attempting A Rebound