


BabyDoge Technical Analysis – December 2021
Monthly Analysis
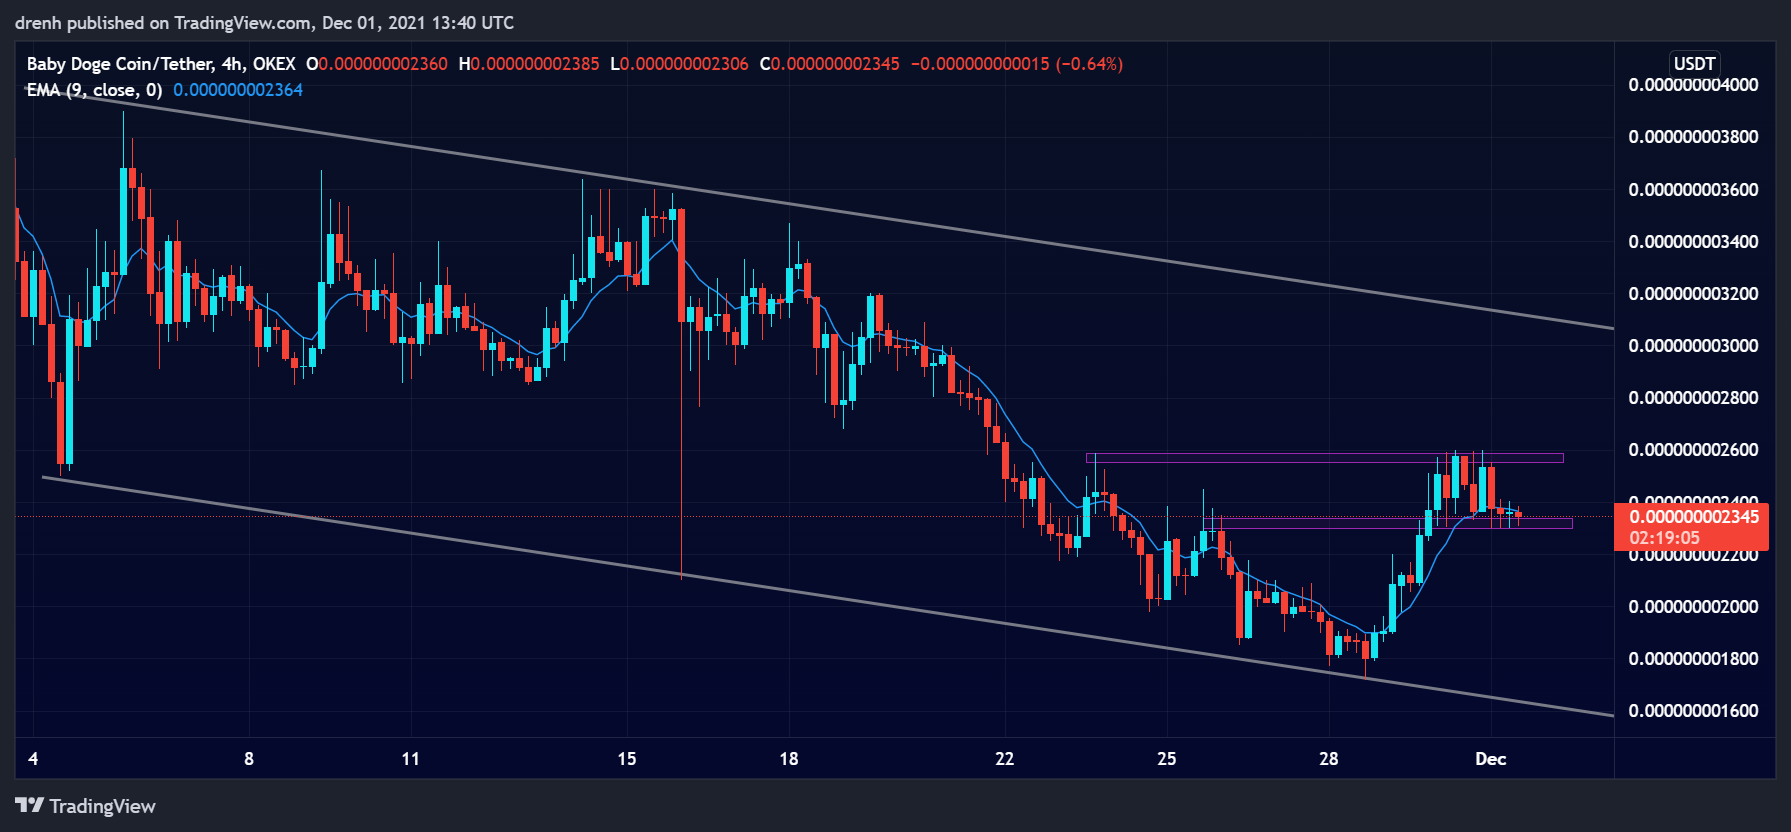
Over the last 30 days, BabyDoge has been bearish. The price initially declined by around 47%. After that, the price was in a correction, but it failed to break the upper line of the downtrend. The price then dropped by an additional 52%. Nonetheless, after finding support at $0.0000000017, the price is now moving upward once again, indicating that the buyers have taken over.

Weekly Analysis
In the last 7 days, BabyDoge was initially bearish. After the price found support at $0.0000000017, the price has started increasing again. The new high is higher than the previous one, indicating a possible reversal. BabyDoge could keep increasing in the short run.
Daily Analysis
In the intraday chart, BabyDoge has been quite volatile. The price has fluctuated by 8-9% in recent hours, and it has been in a phase of consolidation. The coming hours could prove to be crucial on whether BabyDoge reverses the trend or not.
Key Structures
Support
- $0.0000000017
Resistance
- $0.0000000026
Indicators
Moving Average
The 20-moving average of a 4-hour chart is below the price due to the recent increase of BabyDoge. This indicates that the trend could now be upward and that the price of BabyDoge could keep increasing in the coming days.
The 9-EMA is slightly above the price due to the recent retracement in a 4-hour chart. This could see the EMA line act as resistance to the price of BabyDoge. Nonetheless, BabyDoge could find support soon.
Volume
The trading volume of a 4-hour chart has declined in the recent candlesticks, together with the price. With both the price and volume declining, this hints at a possible reversal once the buyers take over.
MACD
The MACD line is now above the price due to the recent upward surge of BabyDoge, indicating that the momentum is bullish in a 4-hour chart. However, with the recent retracement, the lines are now converging, and it could son lead to a shift in the momentum for Baby Doge Coin.
Fear & Greed
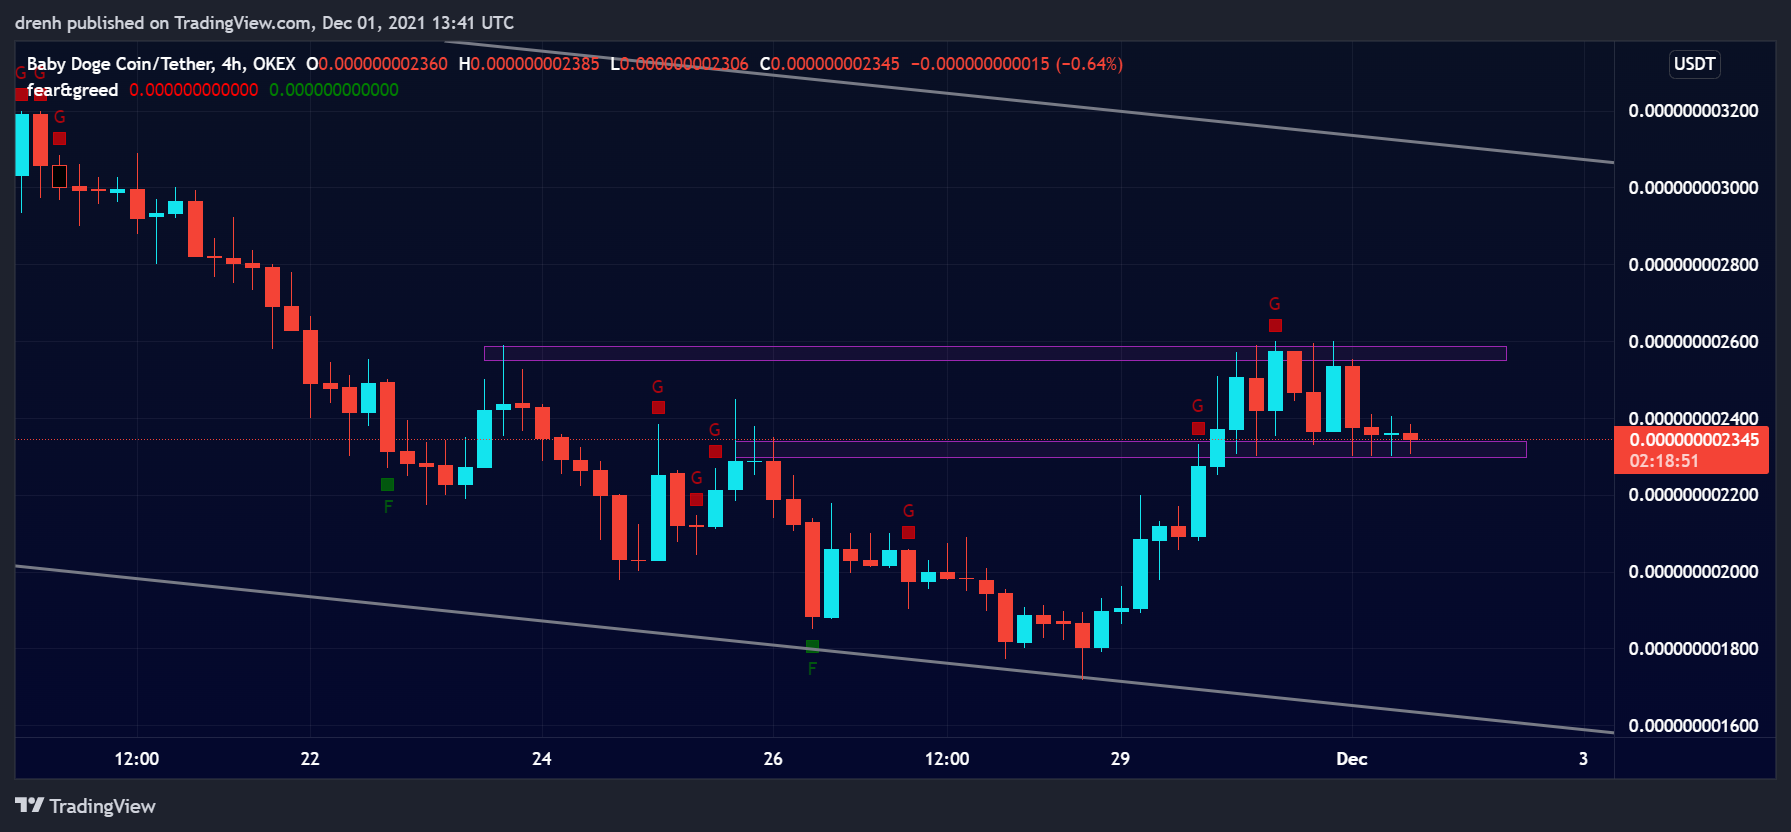
The fear and greed indicator of a 4-hour chart suggests that the current emotion of BabyDoge traders is greed due to the recent bullish breakout. This means that buyers have taken over and that the price of BabyDoge could keep increasing.
Fibonacci
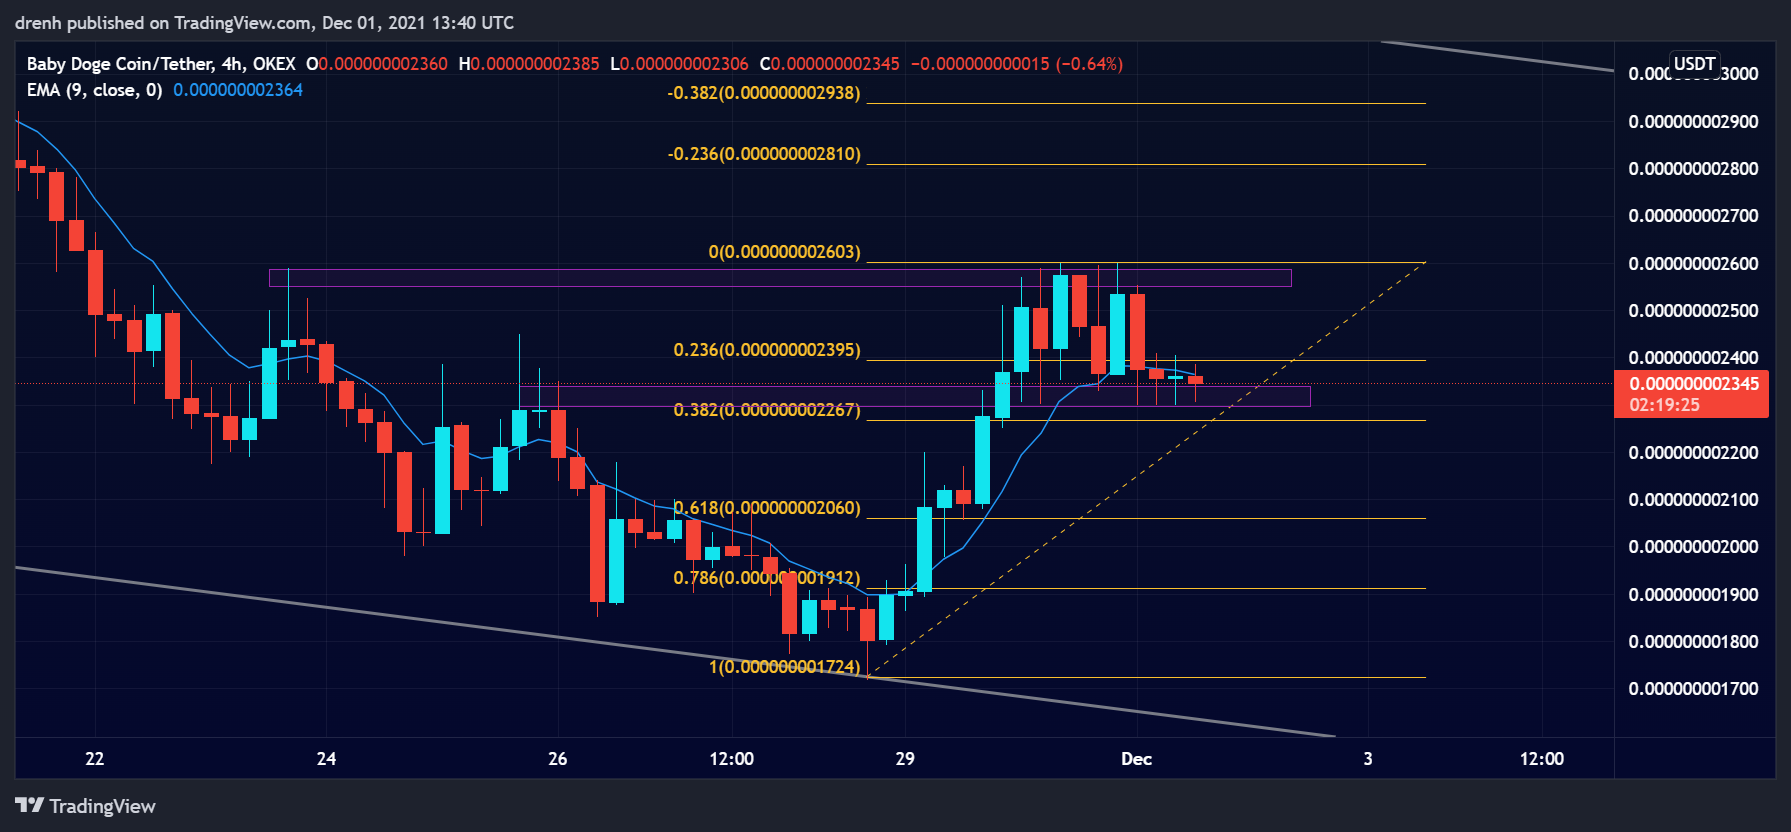
The Fibonacci retracement levels of a 4-hour chart suggest that the price of BabyDoge has retraced to the 38.2% Fibonacci level. It is currently having support at that zone. Furthermore, it also aligns with previous resistance structures, meaning that this support level could prove to be strong and boost the price of BabyDoge even higher.
Price Prediction BabyDoge – December 2021
Based on this technical analysis on Baby Doge Coin (BabyDoge) we could see its price have another upward surge soon as the recent price pattern and our indicators suggest so. BabyDoge could break resistance at $0.0000000026 and continue its journey upward. Once the trend moves upward and the momentum of BTC continues, we could see BabyDoge hit a new all-time high this month.
Latest News for BabyDoge – Affecting Price
Baby Doge Coin has recently teased its community with the upcoming NFTs that they are developing. With NFTs becoming more popular, this could greatly impact the price of BabyDoge in the coming weeks.
Also read: Baby Doge Coin Price Prediction 2022 and Beyond- Can BABYDOGE Eventually Hit $1?