

SHIB Technical Analysis – August 2021
Daily Analysis
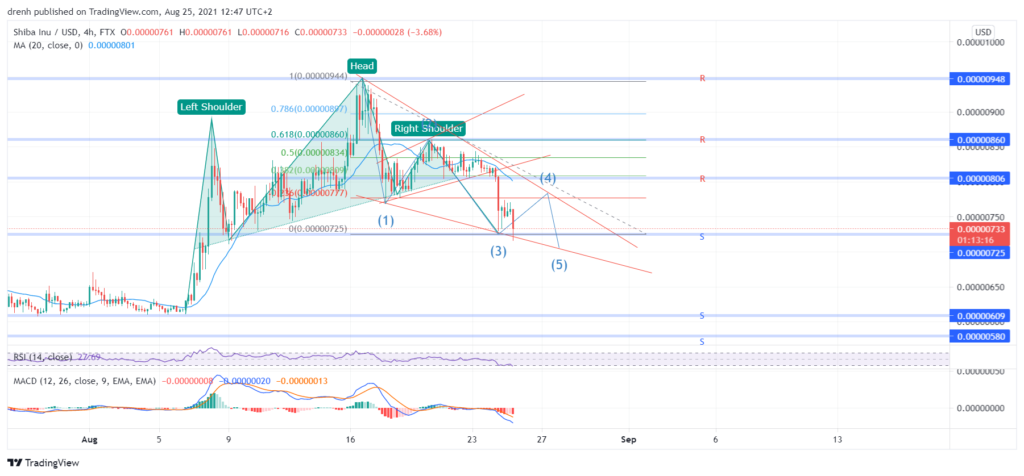
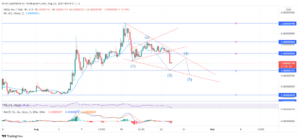
Shiba Inu recently had a reversal and is currently in a bearish trend if it goes at the same rate. From $0.0000095, SHIB has dropped to $0.0000076, which is around a 20% decrease. Breaking the previous resistance indicated that SHIB is heading further downwards and look to find support somewhere else. Based on the price pattern, SHIB might look at a potential correction before continuing further down.
Intraday Thoughts
SHIB as always has been extremely volatile in the last hours. Price has changed a lot and the daily bearish candlestick illustrates the vast price range on which SHIB has traded. Even though SHIB is in a downtrend, an upcoming correction might turn your trades into profit.

Key Structures for Shiba Inu
Support
- $0.0000073, $0.000006, $0.0000057
Resistance
- $0.000008, $0.0000086, $0.0000095
Indicators
Moving Average
The 20-day moving average is slightly above the candlesticks. This moving average might prove to be a point of resistance, but it also indicates that the price may further go down for SHIB. If a correction occurs, the moving average might coincide with the recent candlesticks, but they might not go above it.
Relative Strength Index
The Relative Strength Index (RSI) is currently quite low at around 30. If it goes below this point, SHIB might be looked at as oversold by investors. Consequently, they may increase the price of SHIB again up to the resistance level.
MACD
The Moving Average Convergence Divergence (MACD) also indicates a bearish momentum for SHIB. Recently, MACD has gone below its baseline, which can only mean that traders are continually selling their SHIB tokens.
Fibonacci
Measuring the Fibonacci levels from the beginning of the downtrend, when SHIB reached the highest of this last cycle down to its lowest current price, SHIB might find natural support at the 38.2% level. This level also coincides with a previous resistance and the upper part of the channel. The 50% level also aligns with a recent resistance level at $0.0000084, and the 61% is at $0.0000086.

Head And Shoulders
When drawing a head and shoulders pattern in the recent candlesticks pattern of Shiba Inu, the current price has noticeably gone past the neckline. This indicates a bearish near future for the price of SHIB.

Elliot Waves
Lastly, when looking at the Elliot waves of this current downtrend, SHIB might be at the third wave, which is a little bigger than the first wave. Judging by the Elliot waves, the next correction may take place soon, but then another wave where SHIB goes down can take place.

Price Prediction Shiba Inu – August 2021
The recent hammer candlestick in the 4-hour Shiba Inu / USD chart suggests that the price may increase, but it may only be a correction of the downtrend. This correction might see SHIB go close to the resistance of around $0.000008. If the selling pressure manages to keep SHIB below that level, then Shiba Inu is bearish in the coming days or weeks and perhaps go below $0.000007.
Latest News for Shiba Inu – Affecting Price
Despite our technical analysis, it is worth pointing out some news that relates to Shiba Inu’s fundamentals, which can have a large effect on its price. To begin with, English Premier League team Watford FC has recently promoted Dogecoin-like cryptocurrencies by putting the face of the DOGE dog in the team’s kits. This does not only affect Dogecoin but also its competitors such as Shiba Inu largely. Perhaps such occasions might increase the price of SHIB higher than it is anticipated.
If you want to learn more about the differences between Shiba Inu and Dogecoin, check out this article: