


SAMO Technical Analysis – December 2021
Monthly Analysis
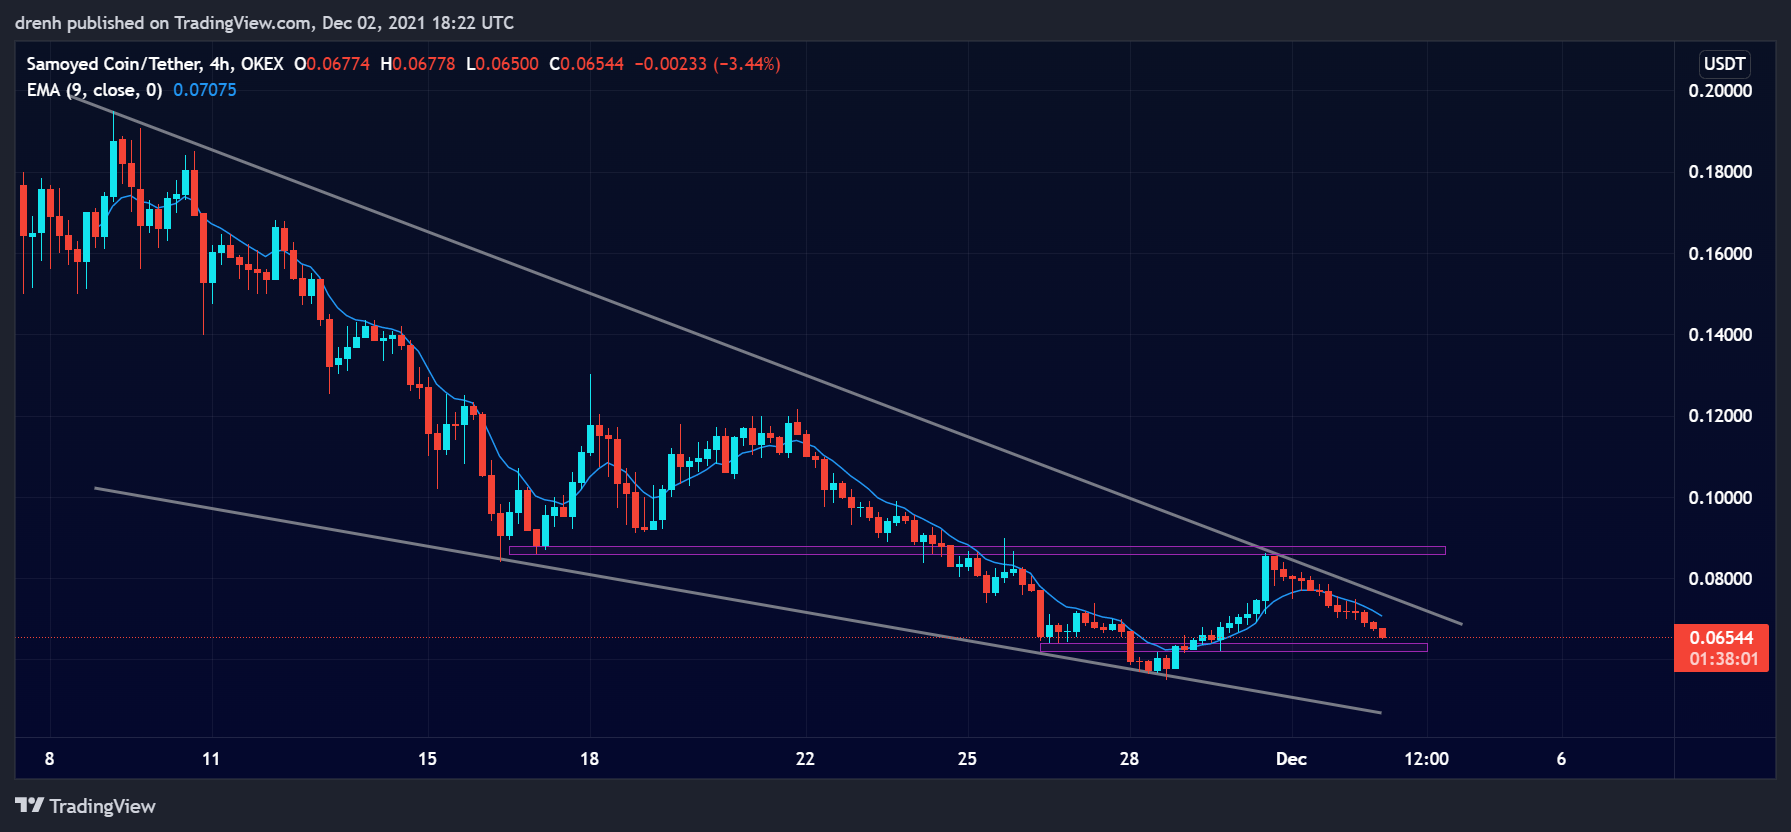
Over the last month, SAMO had a difficult month in terms of price. The price went down by around 70% within 30 days, making the trend downward for SAMO. The rice has recently found support at $0.055, and then it increased by 57%. However, it faced resistance at $0.086. The price is now retracing further down.

Weekly Analysis
In the last 7 days, SAMO initially declined by 38% before it had the above-mentioned upward surge. Nonetheless, the price is now declining again. It has retraced by around 25% so far in recent days. The trend remains bullish for SAMO, even if the recent high was higher than the previous one.
Daily Analysis
SAMO was highly volatile in the intraday chart. The price was bearish in the shorter time frame as well. It has declined by 13% in the last 24 hours. The price could keep declining in the short run.
Key Structures
Support
- $0.055
Resistance
- $0.086
Indicators
Moving Average
The 20-moving average of a 4-hour chart is above the price of SAMO, indicating that the current trend is still facing downward and that the price of SAMO could keep declining in the coming days.
The 9-EMA is also above the price, indicating that the EMA line could as resistance to the price of SAMO attempts to increase in the short run.
Relative Strength Index
The RSI of a 4-hour chart is approaching 30, meaning that SAMO could soon become oversold. That would see the price of SAMO go upward until the RSI corrects.
MACD
The MACD line is below the signal line, meaning that the current emotion of a 4-hour chart is bearish for Samoyedcoin. The price could keep declining because of this.
Fear & Greed
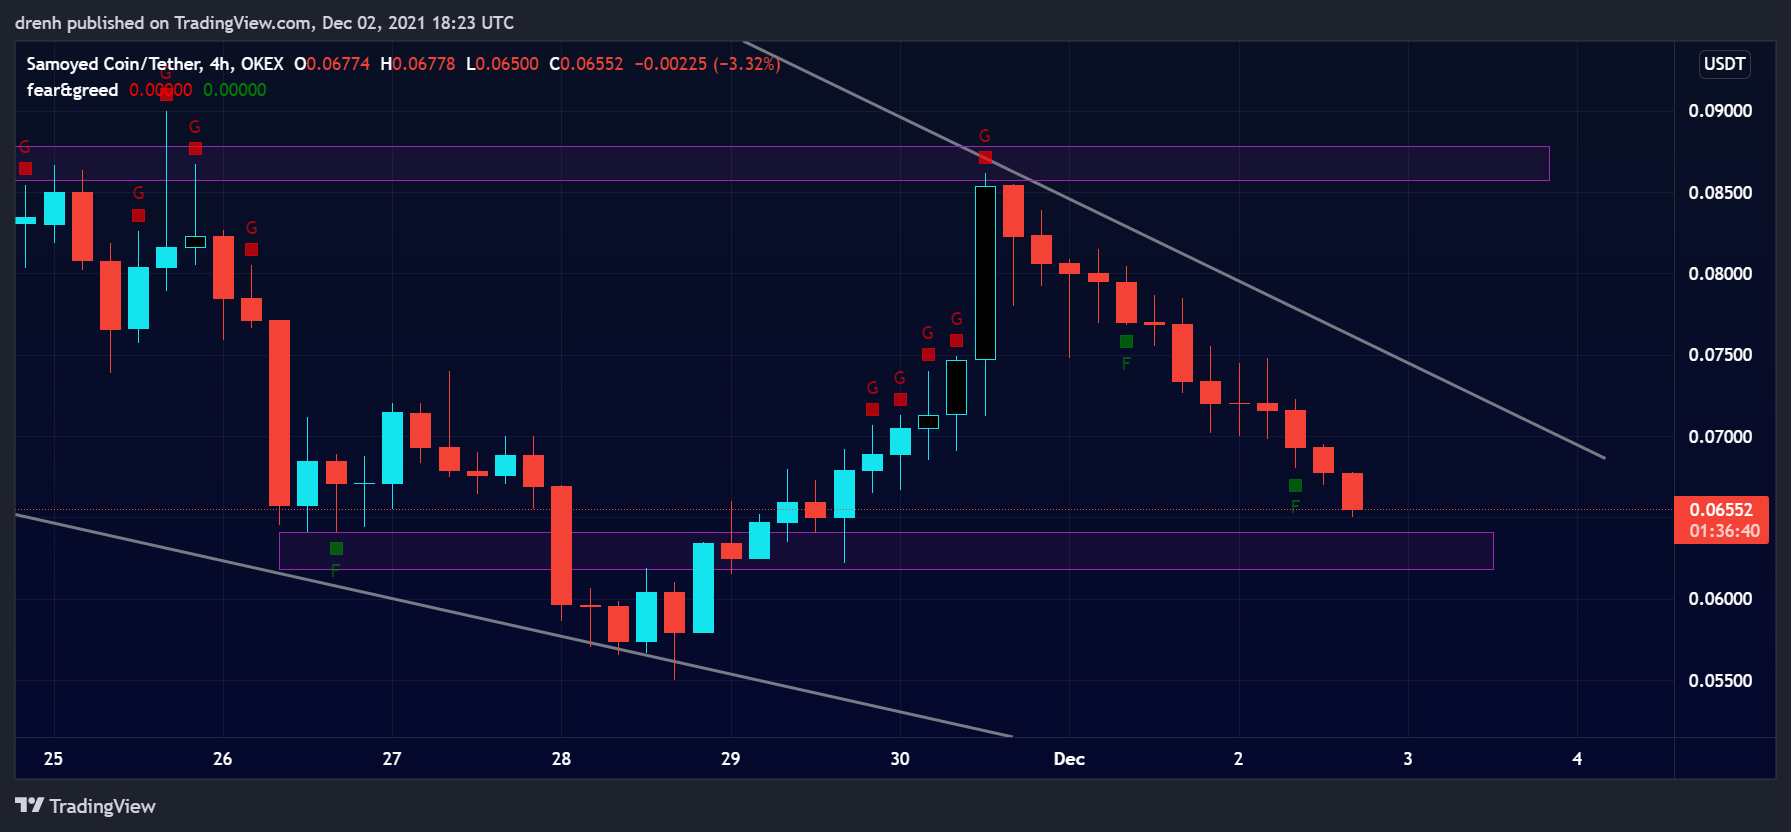
The fear and greed indicator of a 4-hour chart suggests that the current emotion of SAMO traders is fear due to the recent decline in the price.
Fibonacci
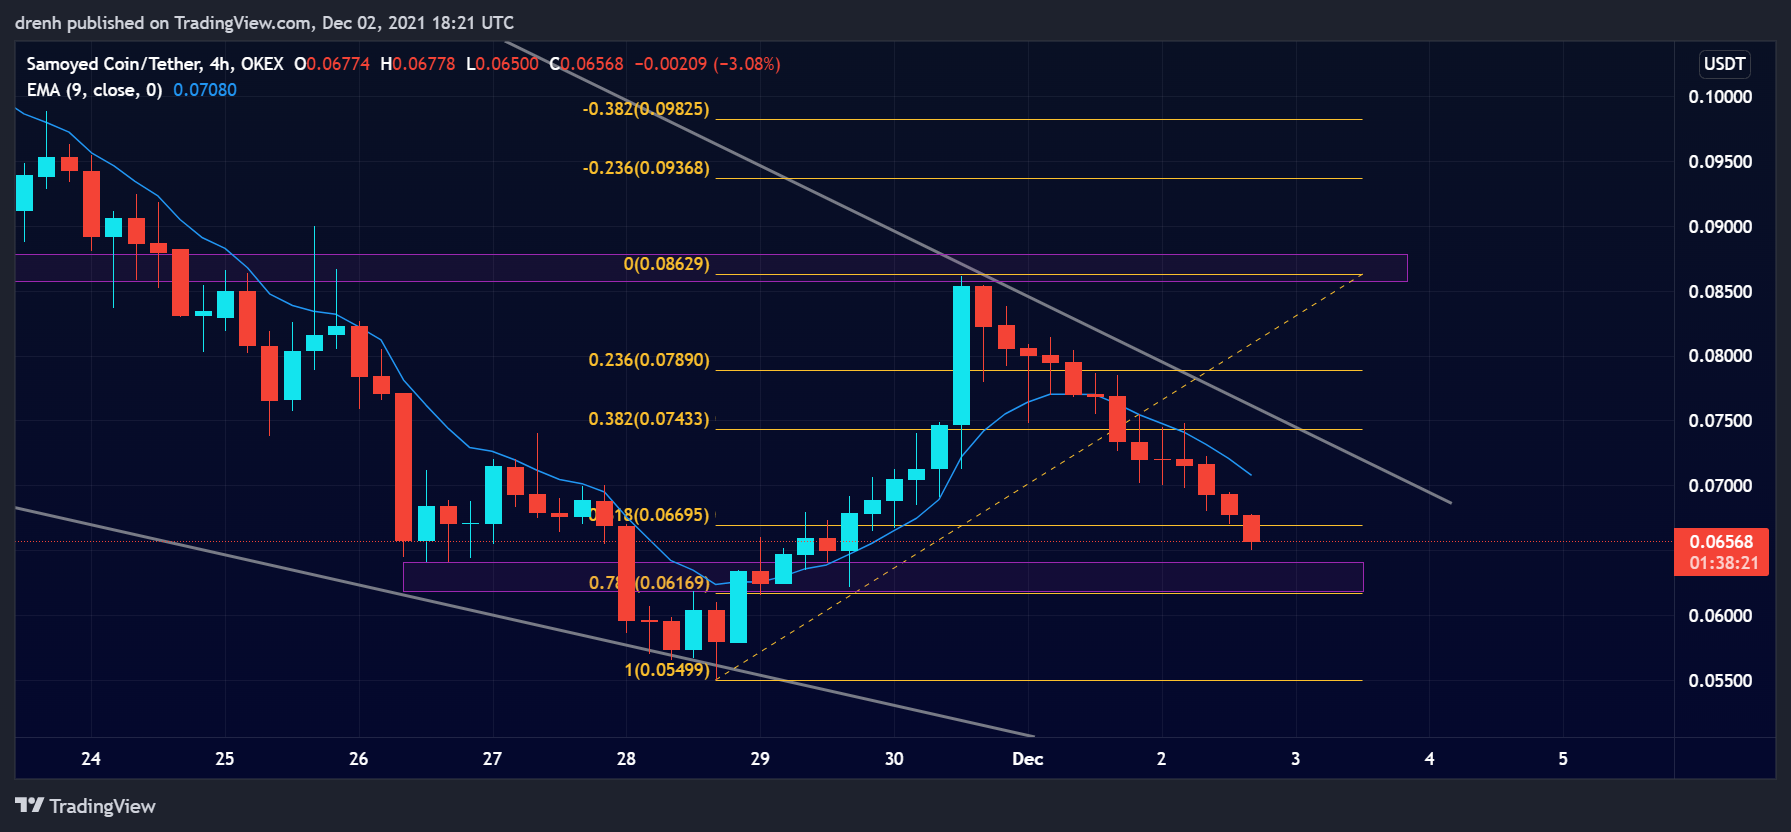
The Fibonacci retracement levels suggest that SAMO has broken both the 38.2% and the 61.8% levels. The price could find support close to the 78.6% level since it also aligns with previous support.
Price Prediction SAMO – December 2021
Based on this technical analysis of Samoyedcoin (SAMO), we could see its price find support at around $0.06. After that, the price could have a correction, but the trend remains bearish for SAMO in the short run. As for the longer run, SAMO could increase due to other fundamental reasons. A price of $0.30 is still attainable in this cycle.
Latest News for SAMO – Affecting Price
Recently, the total value locked in Solana became around $15 billion. This could mean great things for the Solana ecosystem, including the price of Samoyedcoin.
Total Valued Locked (TVL) on #Solana is back above $15B. 💪
All-time high soon?! 😱
Leaders by TVL:
1. @RaydiumProtocol ($2B)
2. @MarinadeFinance ($1.68B)
3. @ProjectSerum ($1.63B)
4. @QuarryProtocol ($1.38B)
5. @orca_so ($1.16B) pic.twitter.com/KJHQQqG6H5— Samoyedcoin (SAMO) (@samoyedcoin) December 2, 2021
Also read: Samoyedcoin (SAMO) Price Prediction 2022 and Beyond – Can SAMO Eventually Hit $5?