


XRP Technical Analysis – September 2021
Monthly Analysis
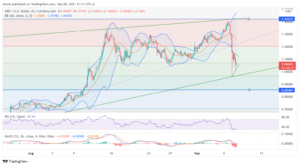
Over the last month, XRP increased by more than 100%. Reaching a price of $1.42, XRP started declining after that, and it broke the support level at $1.05. This might indicate that XRP might have reversed and now is looking to go further down based on the recent price pattern.

Weekly Analysis
XRP increased by 23% in the last 7 days, but then it decreased by more than 30%. This decrease, marked by a big red candlestick in a daily chart, shows that sellers have taken over and that XRP might be bearish in the short run.
Daily Analysis
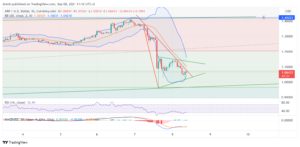
In an intraday chart, XRP has been volatile and has had a correction, increasing slightly in the last hours. In a 1-hour chart, we can also see a symmetrical triangle pattern forming, where the breakout might occur either way. Since XRP has been bearish, we might see the breakout occur downwards and XRP go even lower.

Key Structures
Support
- $0.85
Resistance
- $1.42
Indicators
Moving Average
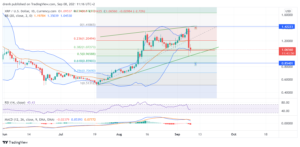
The 20-day moving average has now gone above the price due to the recent price decrease. This is an indicator that the trend has now reversed and that this MA can serve as a resistance in the coming days for Ripple. The 50-day moving average is still below the price and has acted as support in the last hours. In the longer term, this MA can still serve as support.
The 9-day EMA has also gone above the price, and now it might be a strong level of resistance in the upcoming days.
Relative Strength Index
After being overbought a couple of days ago, the RSI now has decreased sharply to less than 50. This decrease in the RSI showcases a bearish momentum. However, this also means that XRP has enough space to grow again if this last price decline was just a retracement.
MACD
The daily MACD is below the signal line and is now aiming to go below the baseline. This is another indicator that the momentum has changed and that XRP might go further down since sellers have taken over.
Fibonacci
If we look at the Fibonacci levels from the beginning of the recent uptrend, then we can see that the 61.8%, which is a natural level of Fibonacci, might act as support in the coming days. If the price retraces to that level and bounces back, then we could as well see another increase for XRP in the longer term, where the Fibonacci extensions suggest that a price of $1.63 is possible, other things equal.

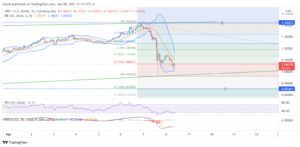
Looking at the recent downtrend in an intraday chart and draw the Fibonacci levels, we can see that the Fibonacci extension level at -23.6 coincides with the longer-term Fibonacci 61.8% level. Judging by that, this level could be a very strong level of support, where even the trend might reverse again.

Price Prediction Ripple – September 2021
Based on this technical analysis, we could see XRP go further down based on the recent descending channel. In the long term, XRP is still bullish, that is why XRP might go down to $0.85, but it may as well begin increasing again after that level.
Latest News for Ripple – Affecting Price
Ripple is under investigation from the U.S. Securities and Exchange Commission, and the court case has adversely affected the price of XRP over the months. If XRP beats the lawsuit, its price growth is inevitable. However, the lawsuit is taking longer than anticipated, so the trading nature of XRP remains uncertain.
Also read: Ripple Price Prediction 2021 – Will the XRP Price Explode After the Issue with SEC is Resolved?