


QNT Technical Analysis – December 2021
Monthly Analysis
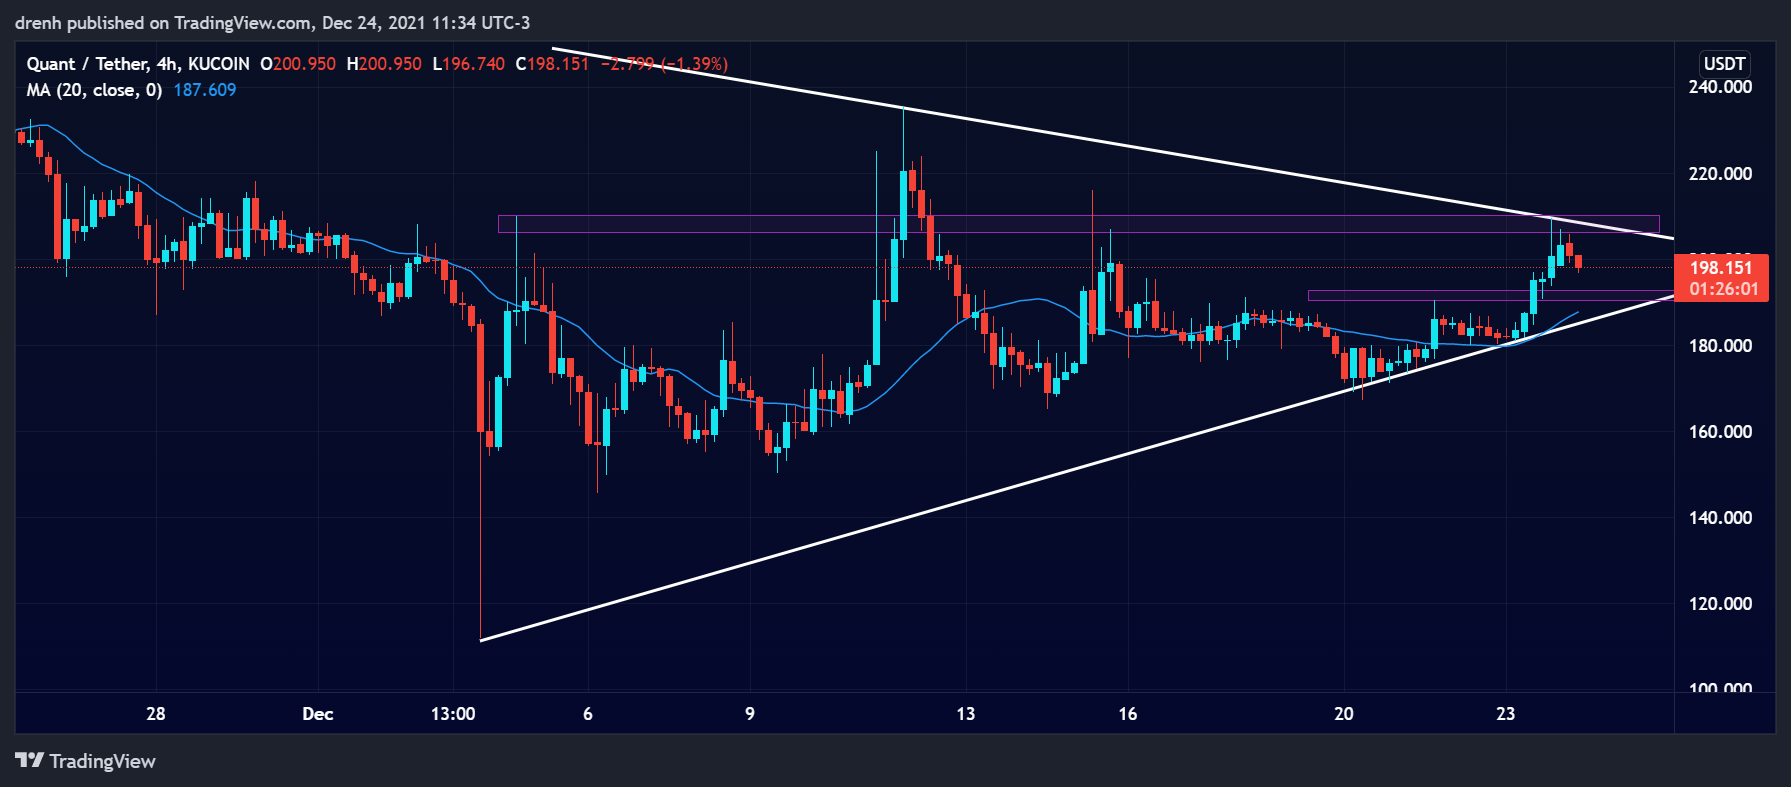
In the last 30 days, QNT was overall bearish as the price declined by around 60%. After the price found support at $111, it entered a correction phase, and then it jumped by around 56%. The recent price movement has formed a triangle pattern, indicating that we could see the price of QNT have a breakout soon.

Weekly Analysis
In the last 7 days, the price of QNT has been generally bullish, as the price increased by around 25%. It recently hit resistance at $209, indicating that the price may now retrace. Overall, QNT is currently bullish and could look to continue this trend in the coming days.
Daily Analysis
In the intraday chart, the price of QNT has been highly volatile, as the price has declined by around 5%. Being bearish in the shorter term, we could expect the price of QNT to keep retracing in the coming hours.
Key Structures
Support
- $190
Resistance
- $209
Indicators
Moving Average
The 20-MA line of a 4-hour chart is currently below the price of QNT, indicating that the price of QNT could keep increasing in the coming days as the trend is facing upward.
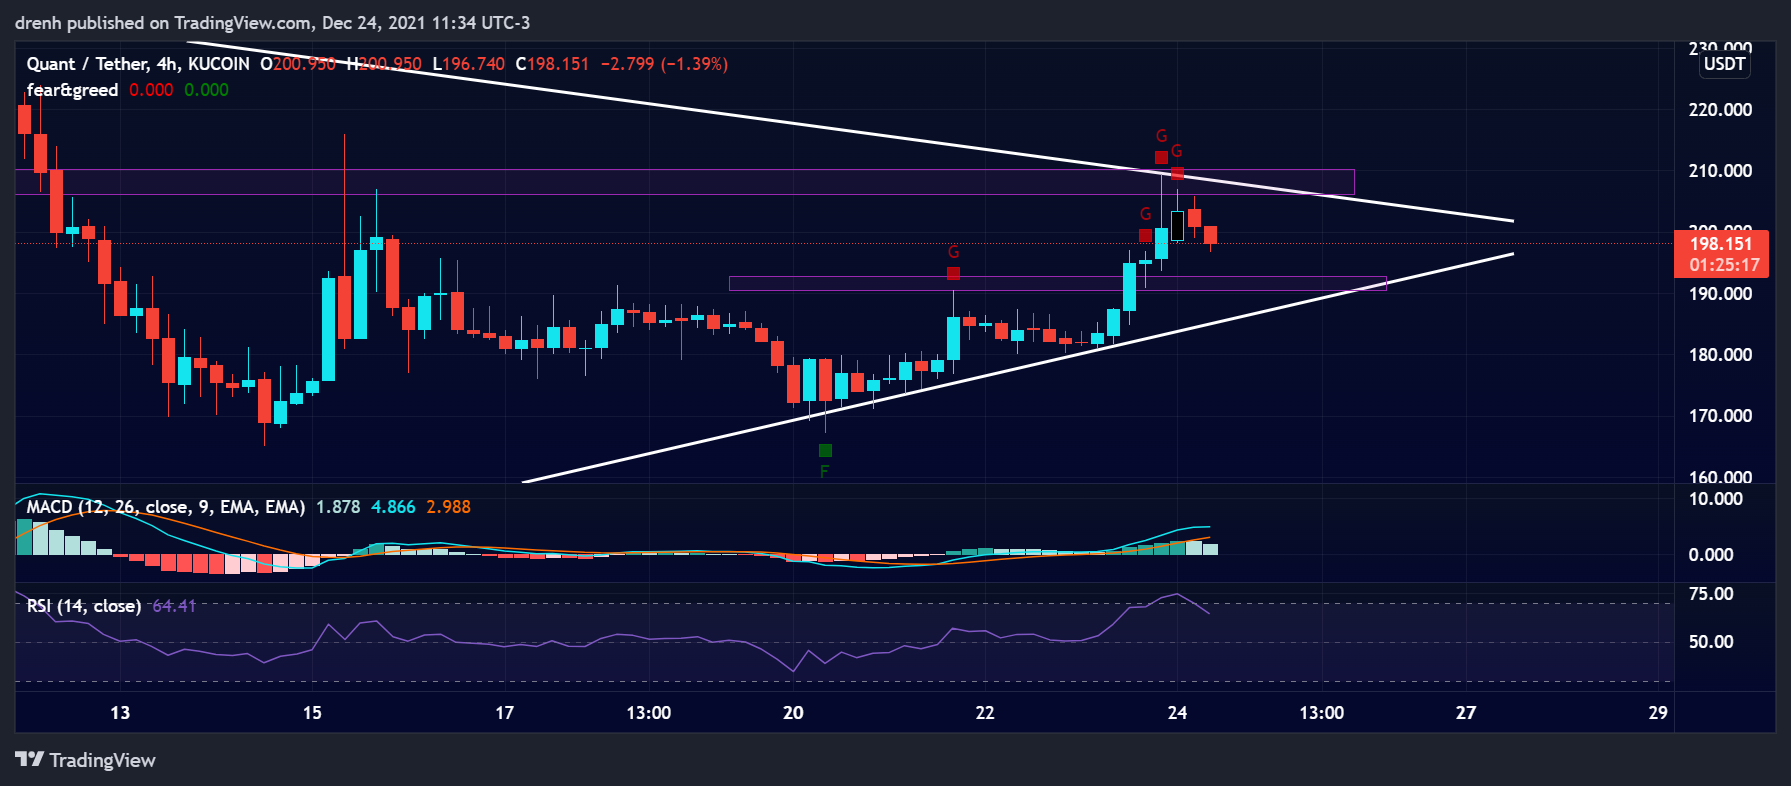
The 9-EMA of a 4-hour chart is also slightly below the price, indicating that QNT is bullish in the short run and that the EMA line could act as support if the price attempts to further retrace in the coming days.
Relative Strength Index
The RSI of a 4-hour chart has recently hit above 70, indicating that QNT became overbought. This led to the price retrace recently. We could see the price to further decline until the RSI is well within the 30-70 range.
MACD
The MACD line of a 4-hour chart is quite above the signal line and above the baseline, indicating that the current momentum of Quant is bullish. This could see the price keep increasing in the coming days. Nonetheless, the lines have recently started converging due to the recent retracement.
Fear & Greed
The fear and greed indicator of a 4-hour chart suggests that the current emotion of QNT traders is greed, meaning that Quant is bullish.

Fibonacci
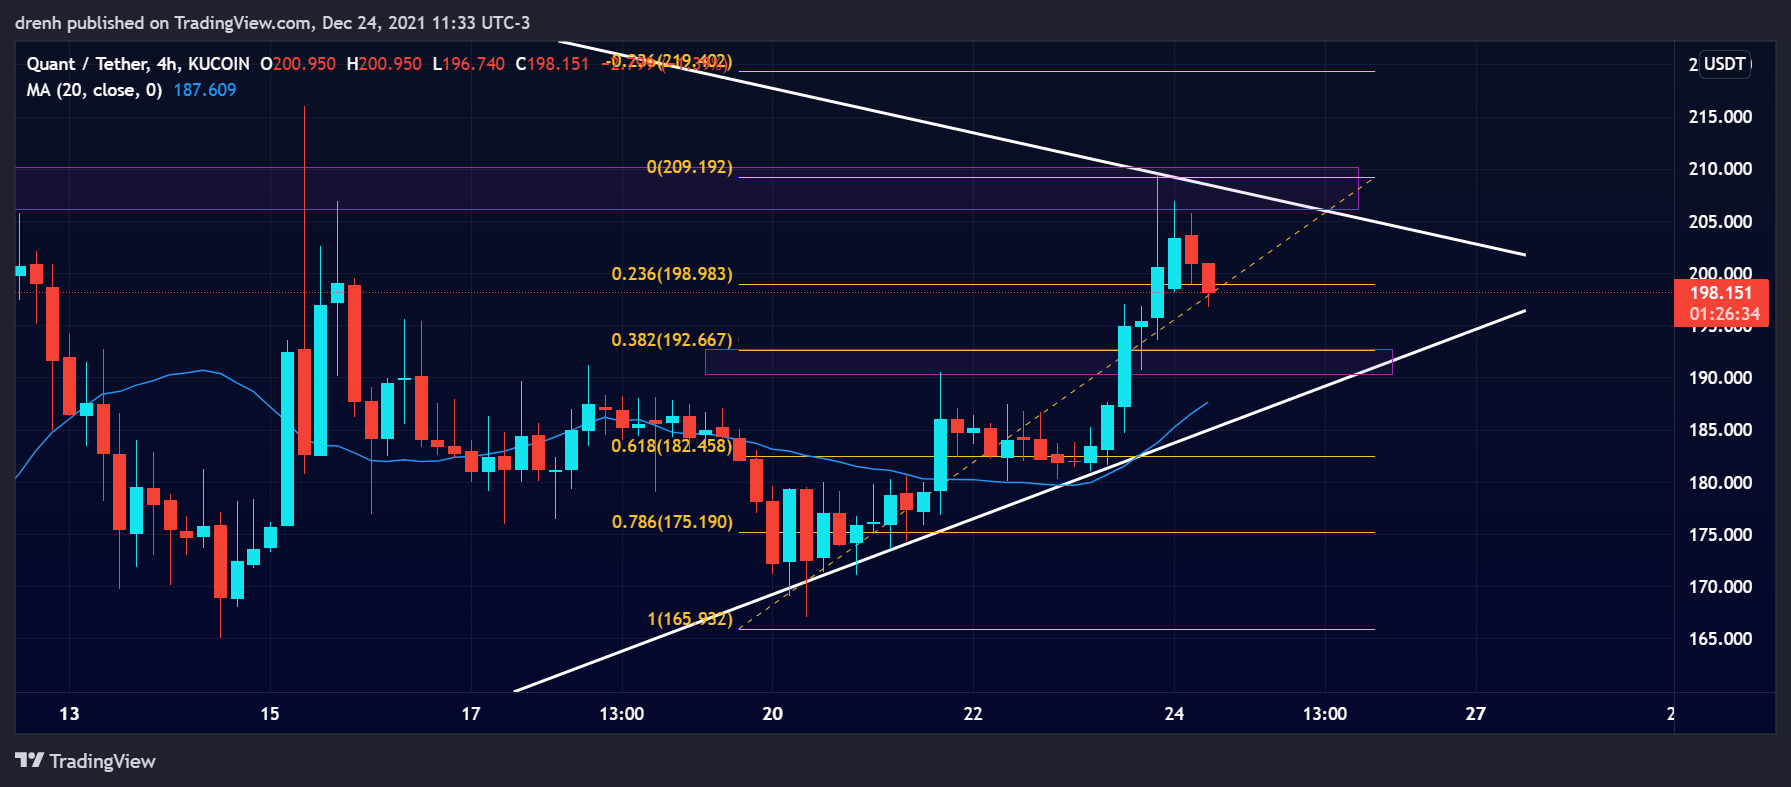
The Fibonacci retracement levels suggest that the price could retrace in the coming days. The 38.2% level could prove to be a strong support structure as it also coincides with the previous resistance level.
Price Prediction QNT – December 2021
Based on this technical analysis on Quant (QNT), the price of QNT could keep declining down to around $190. Then, we could see the price have another go upward, as the price could go above $220 in the coming days. If that momentum continues for QNT, a price of $300 is attainable in the coming weeks.
Latest News for QNT – Affecting Price
Quant Network has recently announced that users can use QNT to pay for licenses through the use of Overledger. This could greatly increase the demand for QNT tokens and increase the price in the coming weeks.
New release of Overledger.
Among the enhancements in 2.1.5, the latest version of Overledger, is the ability to pay licences in $QNT.
More at: https://t.co/J8TLjnNL68#Overledger
— Quant (@quant_network) December 21, 2021
Also read:
Quant Review – Is Quant (QNT) a Good Investment?
Quant Price Prediction – Can Quant Reach $1000?
Quant Price Prediction 2022 and Beyond – Will QNT Reach $1000?
Quant Price Prediction 2023 – What Will QNT Price be in 2023?
Quant Price Forecast – What Will Quant (QNT) Price be in 2025?
Quant Price Prediction 2030 – What Will QNT Price be in 2030?