

Litecoin enjoyed one of the best positions in the cryptocurrency market before COVID-19 hit the world, but not anymore. In this Litecoin price analysis, we will take a dive into the current market price, position and movement.
On the 18th of January, LTC price hit the year-to-date (YTD) high of $152.87. Since the January fall, like all other major cryptocurrencies such as Bitcoin, Litecoin is also going through tough times. The next major fall came in May 2022, while the YTD low at $42.14 was observed on the 19th of June 2022.
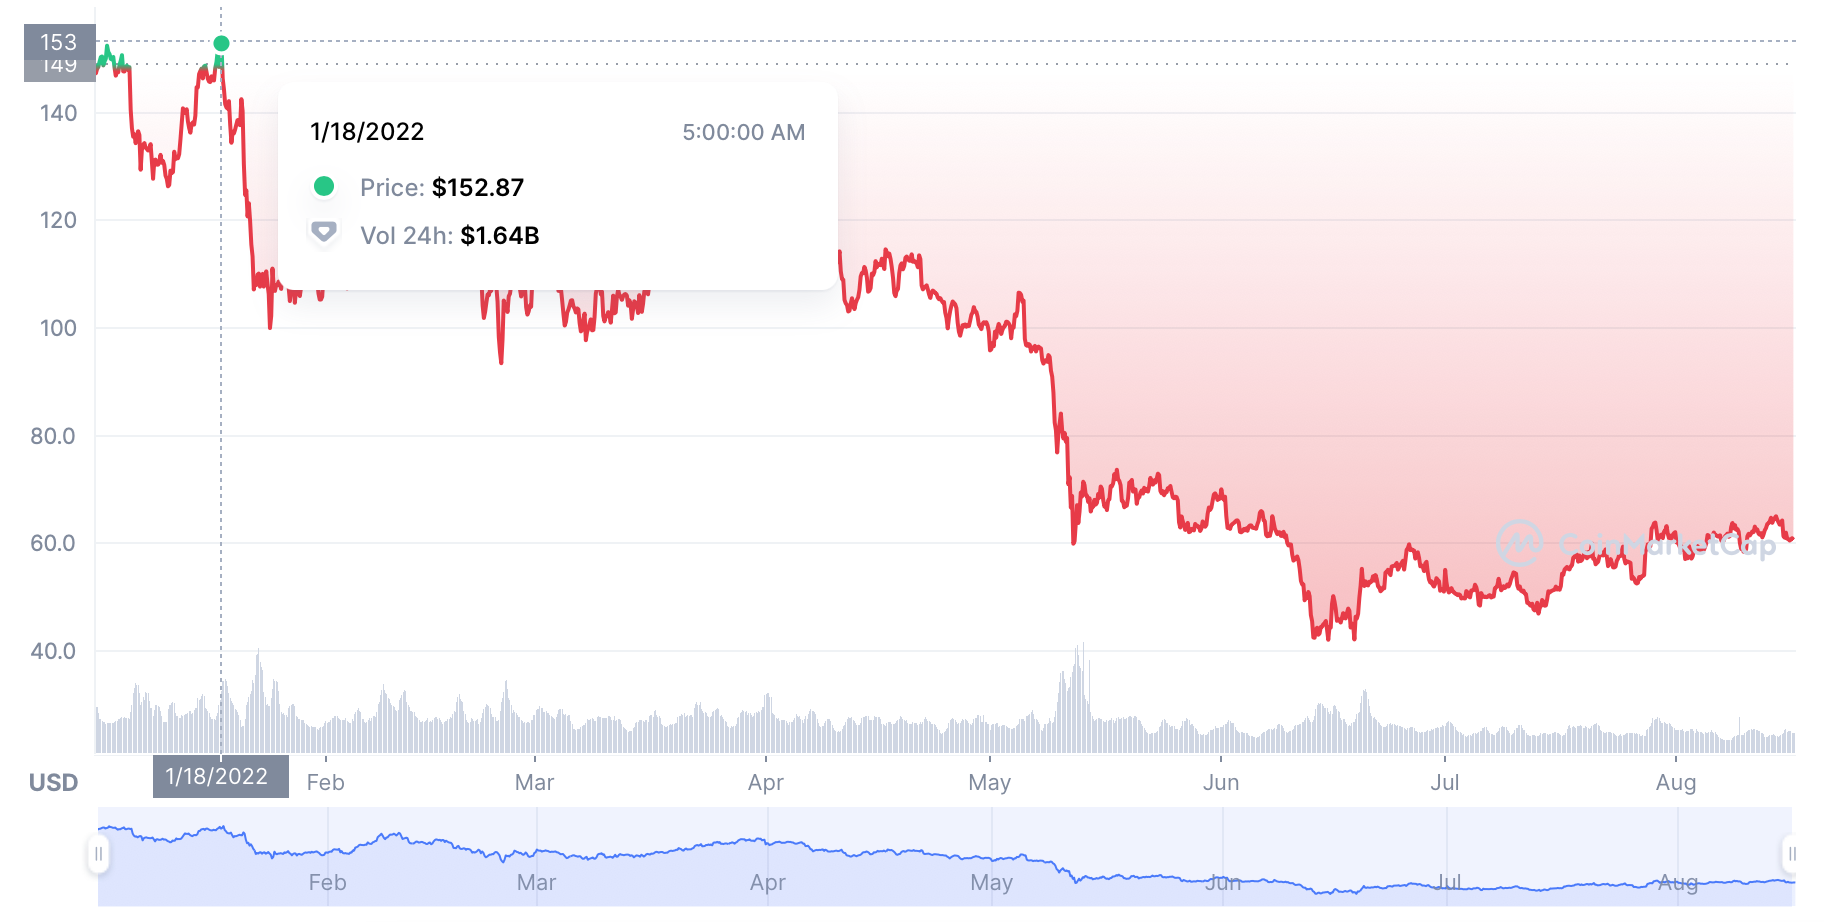
Litecoin price chart by CoinMarketCap

Litecoin has been moving stable since the June fall and above the $50 mark except for a brief dip in July. So far, August has been very good for the cryptocurrency market, and LTC is enjoying the same benefits. Litecoin has been stable above the $55 mark most of the month.
Litecoin Price Analysis: Head and Shoulder pattern may pull price down
Litecoin price saw a spike to the $65 mark recently on the 14th of August. The cryptocurrency displayed no aggressive buying signals, however, a reverse head and shoulder pattern is visible on the price analysis chart.
As it is common with the head and shoulder that a reverse or straight head and shoulder pattern follow the other, the reverse head and shoulder pattern’s closing shoulder extended into the currently building head and shoulder movement. A reverse head and shoulder displays bullish momentum, while a head and shoulder pattern is a sign of bearish momentum building on the charts.
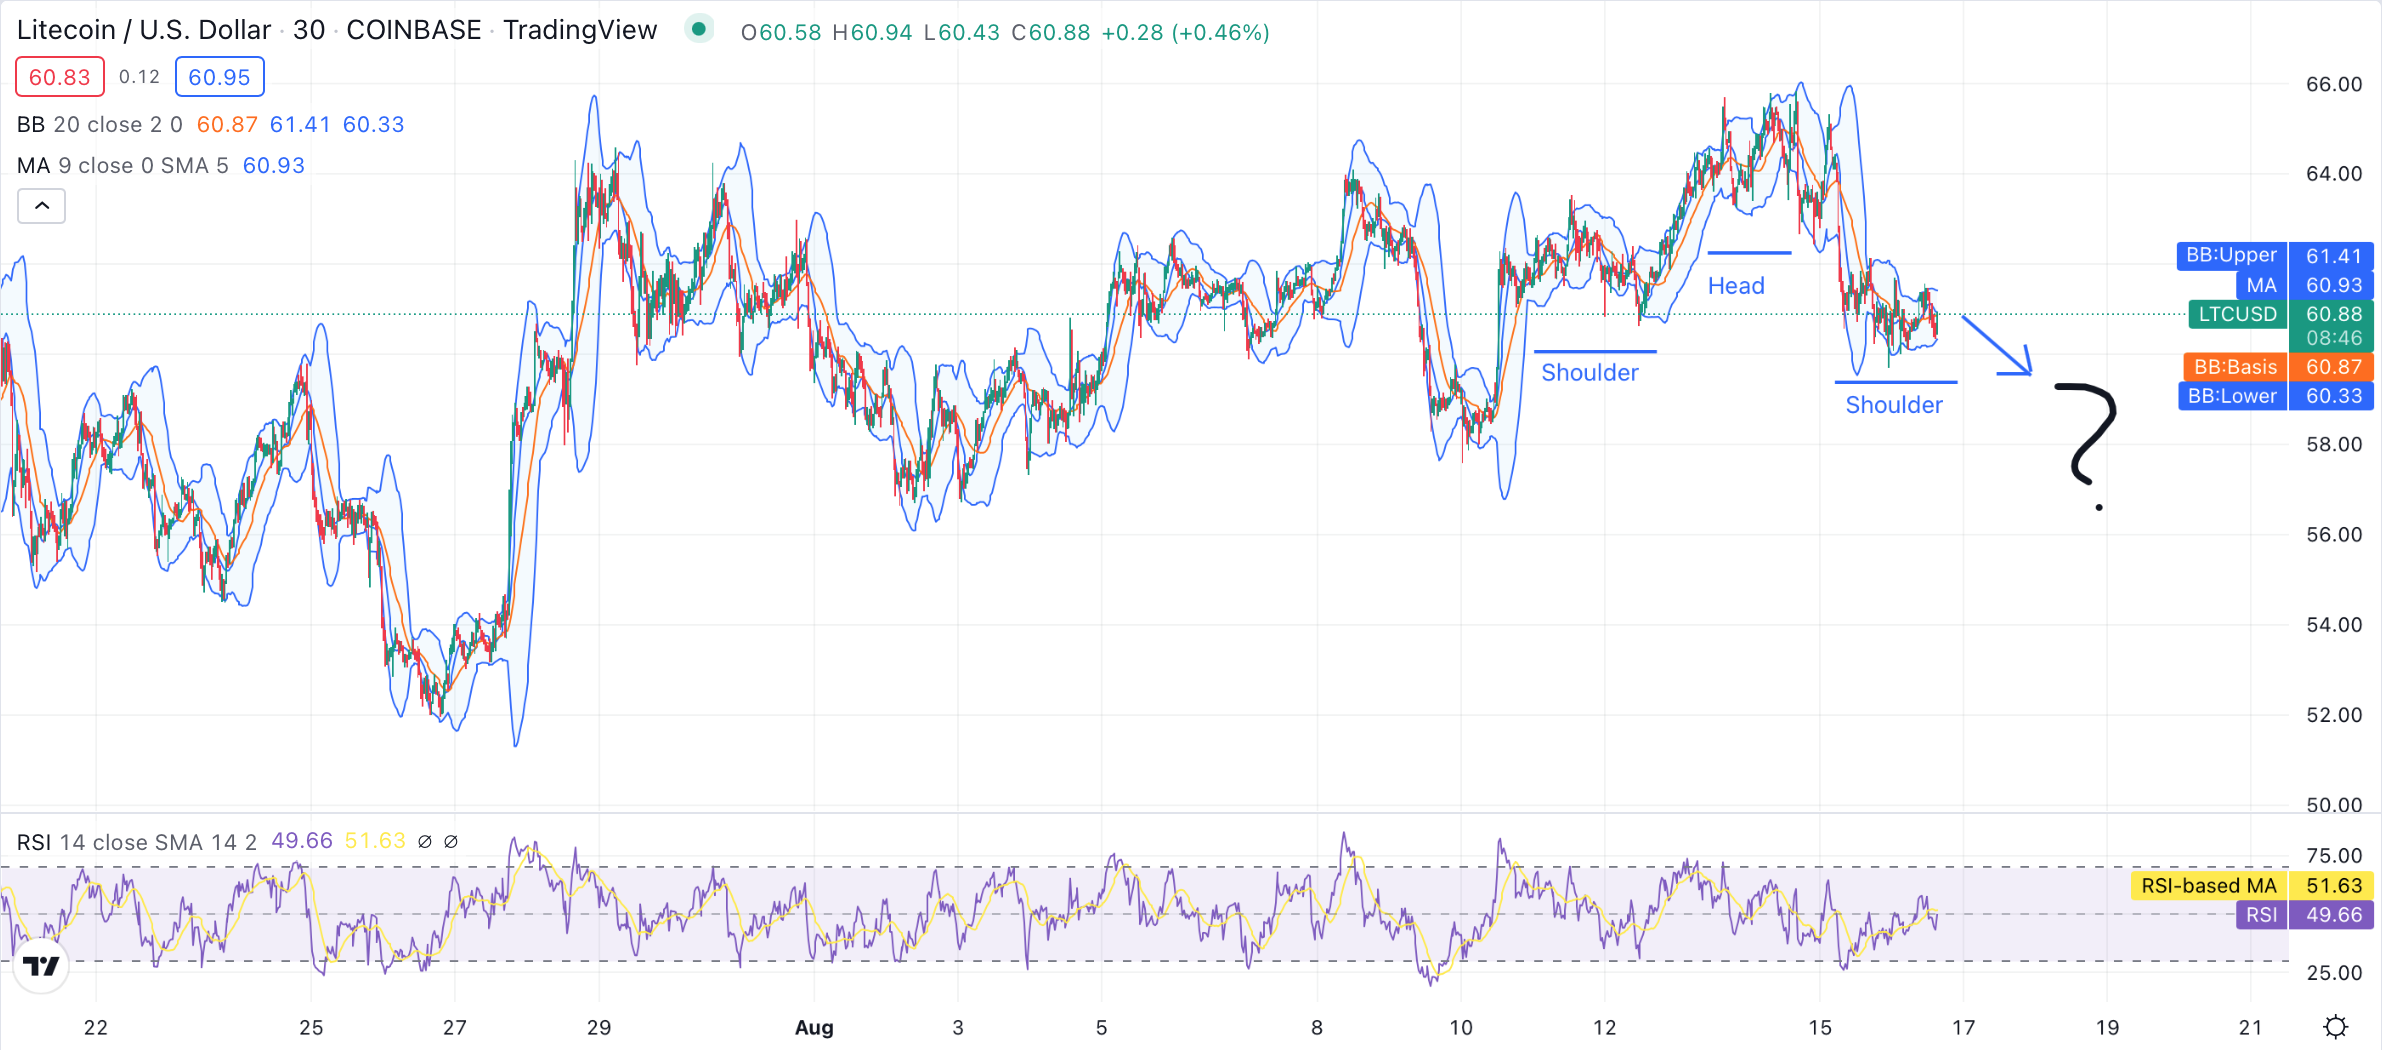
Litecoin price analysis chart made with TradingView

Although the technical indicators are showing a neutral position on the charts, the overlying pattern cannot be ignored. With the Litecoin price standing at the $60.88 mark, the current support is found at the Bollinger Band average (BB: Basis) 60.87 mark. The strongest support lies with the Bollinger Band lower mark found at the $60.33 mark.
The first bearish signal is with the moving average (MA) standing above the current price, posing the first resistance level at the $60.93 mark. While the Bollinger Band upper is posing the strongest resistance at the $61.41 mark.
The relative strength index (RSI) chart shows neutral movement with a score of 49.66. While the RSI moving average stands slightly higher at the 51.63 mark. There have been no major overbuying or overselling breaches in the past 24 hours, making the movement primed for a neutral stance. However, the overall movement is leaning towards overselling.
The currently forming overlying pattern is the major indicator at the time of writing. The head and shoulder pattern is something that cannot be ignored despite the other indicators showing a neutral and somewhat stable movement.
Traders are advised to keep their eye on the current movement since the price can fall as far down as $58. If LTC fails to find support at the $58 mark, the price can fall further down to the $56 mark as well.
However, on the other hand, although unlikely but if a buying streak happens, Litecoin price may stay more stable and out of the currently building bearish momentum.
TakeAways
- Litecoin is priming into a head and shoulder movement.
- Litecoin price may drop down to $58 mark.
- If LTC loses support, a further drop to $56 mark can happen.
- A buying streak can stabilize the LTC price.
Disclaimer: The information provided on this page is most accurate to the best of our knowledge; however, subject to change due to various market factors. Crypto-Academy encourages our readers to learn more about market factors and risks involved before making investment decisions.