
Link Market Features Recovery Moves – August 5
LINK/USD market features recovery moves on a continued relatively serial formation pattern to the north. The crypto’s price trades around $23, close to the immediate resistance line at $25 at a negative percentage rate of 1.95.
Features Recovery Moves: LINK Market
Key Levels:
Resistance levels: $25, $30, $35
Support levels: $20, $17, $14
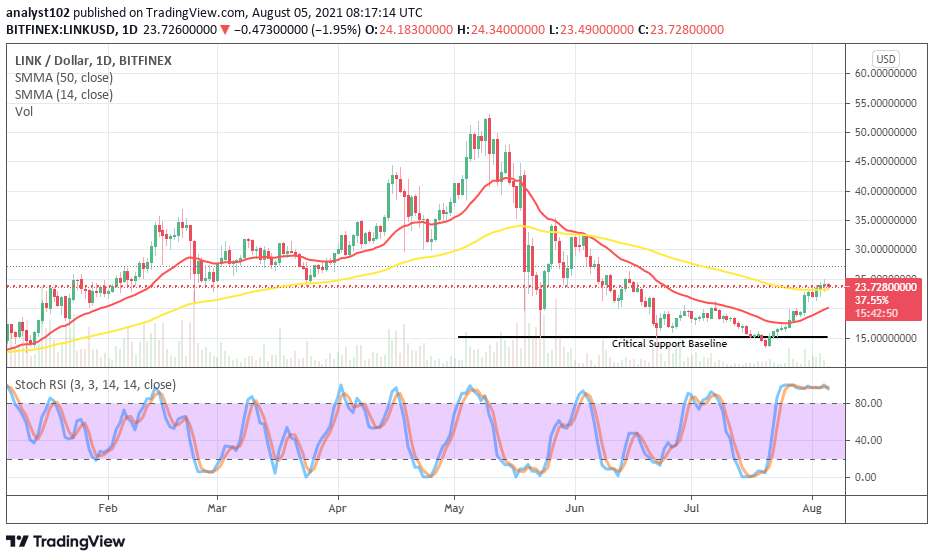
LINK/USD – Daily Chart
The LINK/USD daily trading chart reveals that the crypto market features recovery moves after a declining trading situation that got exhausted between the past sessions of July 19 and 20. The emergence of a bullish candlestick against the critical support baseline at $15 sets the crypto economy on a kind of straight-line recovery moving manner. The 14-day SMA trend-line has somewhat bent northward beneath the 50-day SMA trend-line. Kind of smaller-lower highs is being formed around the bigger SMA close below the level at $25. The Stochastic Oscillators are with conjoined lines in the overbought region, denoting that the crypto’s recovery strength to push at this capacity trading level is very low.
Will there be a further northward push as the LINK/USD market features recovery moves?
A Strong holding of price in a consolidation moving mood could allow the LINK/USD trade bulls to push further higher as the market features recovery moves until the present. In the meantime, the crypto may have to experience a pit stop around the resistance at $25. As a result, a line of reversal moving pattern may in the near time re-surface probably to allow the market bulls to re-find support to build on.
On the downside, currently, the resistance trading line at $25 appears to be the zone that the LINK/USD market bears needed to be watchful to observe any timely sensitive weakness that could occur on the side of bulls in the market operations. A full-body bearish candlestick formation around that level may potentially signal a safe launching of a sell position.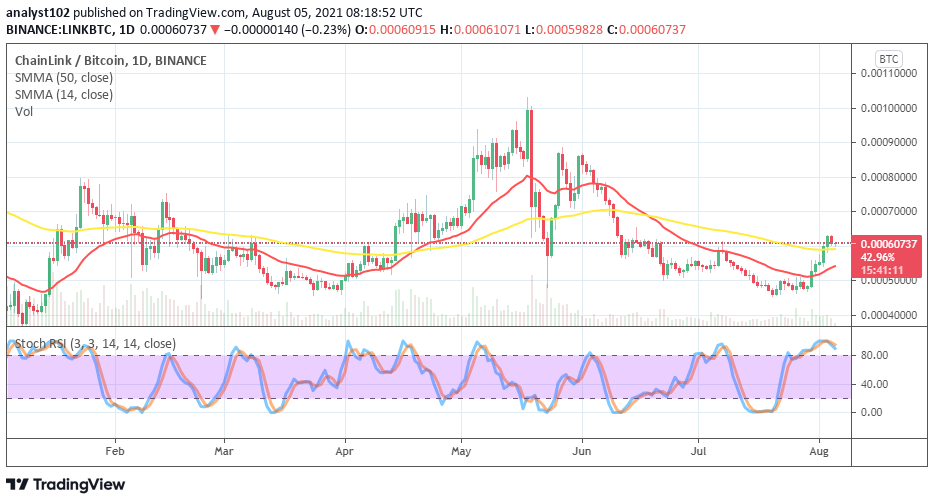
LINK/BTC Price Analysis
Comparing the trending energy between LINK and BTC, the daily price analysis chart depicts that the base crypto market features recovery moves pairing with the flagship counter trading instrument. The 50-day SMA indicator is above the 14-day SMA indicator as the smaller SMA slightly bent northward. The Stochastic Oscillators are in the overbought region with the lines conjoined, pointing southbound to suggest that the base crypto may soon lose grand again to the counter crypto. Therefore, traders may still allow some downs for a while before seeing decent returns to the upside.
Also Read : ChainLink Price Prediction 2021 and Beyond –

