
Bitcoin Price Prediction – August 5
It recorded that the BTC/USD market weakens around $44,000 as it has been severally hovering at that trading zone over time. The crypto operation now trades around the value of $38,332 at a minus percentage rate of about 4.78 as of writing.
BTC/USD Market
Key Levels:
Resistance levels: $42,500, $45,000, $47,500
Support levels: $37,500, $35,000, $32,500
BTC/USD – Daily Chart
The BTC/USD daily trading chart reveals that the crypto market weakens around the level of $40,000. From August 2nd until the 4th, the crypto trade saw more inactive price motions. A bearish candlestick is in the making seemingly takes to a slow and steady moving nature against the bigger SMA trend-line. The 14-day SMA indicator is underneath the 50-day SMA indicator. The Stochastic Oscillators have swerved southbound from the overbought region to locate a position around the range of 40. Yet, they slightly point toward the south to indicate that the downward pressure isn’t over.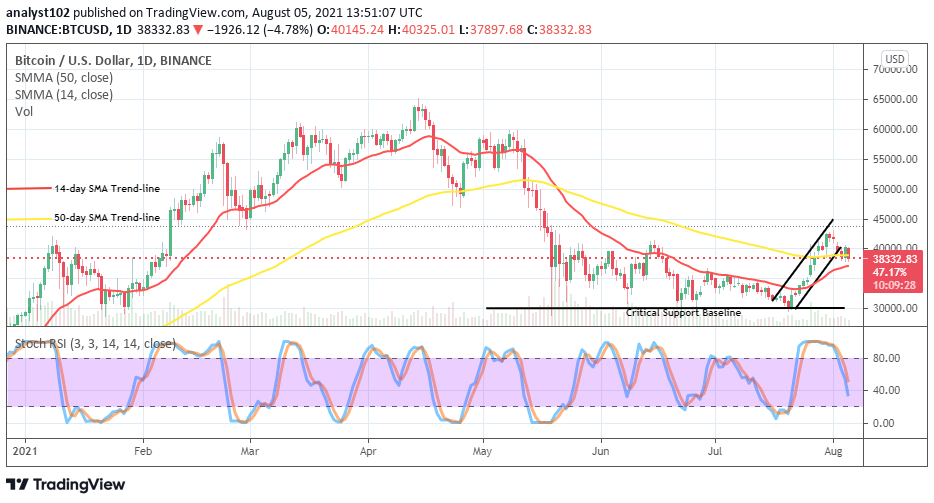
Decency can obtain while traders can detect a timely sensitive positioning entrance in a speculative market. As the BTC/USD market weakens around the level of $40,000 in a slow and steady moving manner may in the near time lead to a sudden hike in no time to suggest another start of an uptrend motion. That may observe, using the trading charts of both 1-hour and 4-hour to get the probable time that that assumption may tend to materialize.
On the downside, a line of trading barriers appears to have created around $40,000. Therefore, the BTC/USD market bears needed to look out for price inactive motions to get a sell entry. The present downward force only indicates that the market weakens on a less-active moving mood. In the light of that, traders considering going shorting further on this crypto market needed to exercise some degrees of trading principles to avoid getting whipsawed as a result of late exertion of position entry.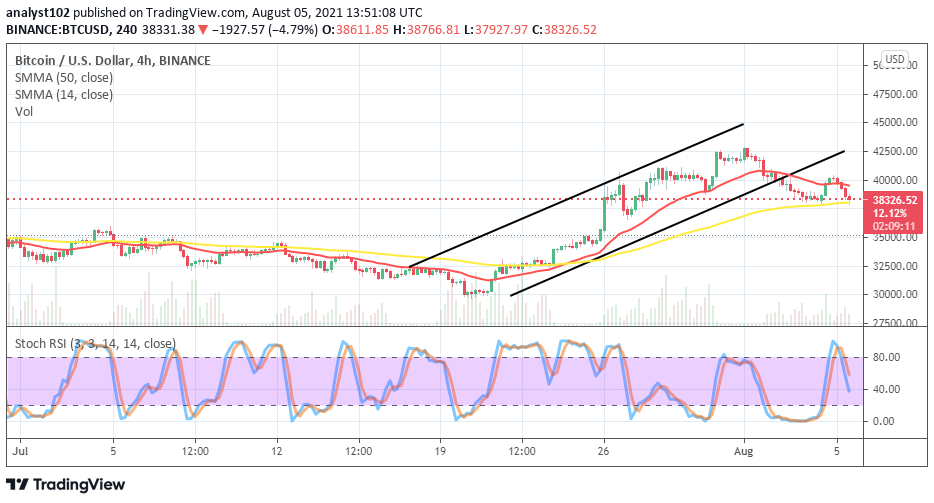
Bullish channel trend lines drew on the medium-term trading chart to locate strategic trading points at resistances of $42,500 and $45,000 as the crypto market weakens around $40,000. The 14-day SMA trend-line has moved southward against the trend-line of the lower bullish channel. The 50-day SMA trend-line is underneath the smaller SMA. The Stochastic Oscillators have swerved southbound from the overbought region, suggesting that the crypto somewhat faces pressure inflicted on it by the US counter fiat trading currency.
