


KISHU Technical Analysis – December 2021
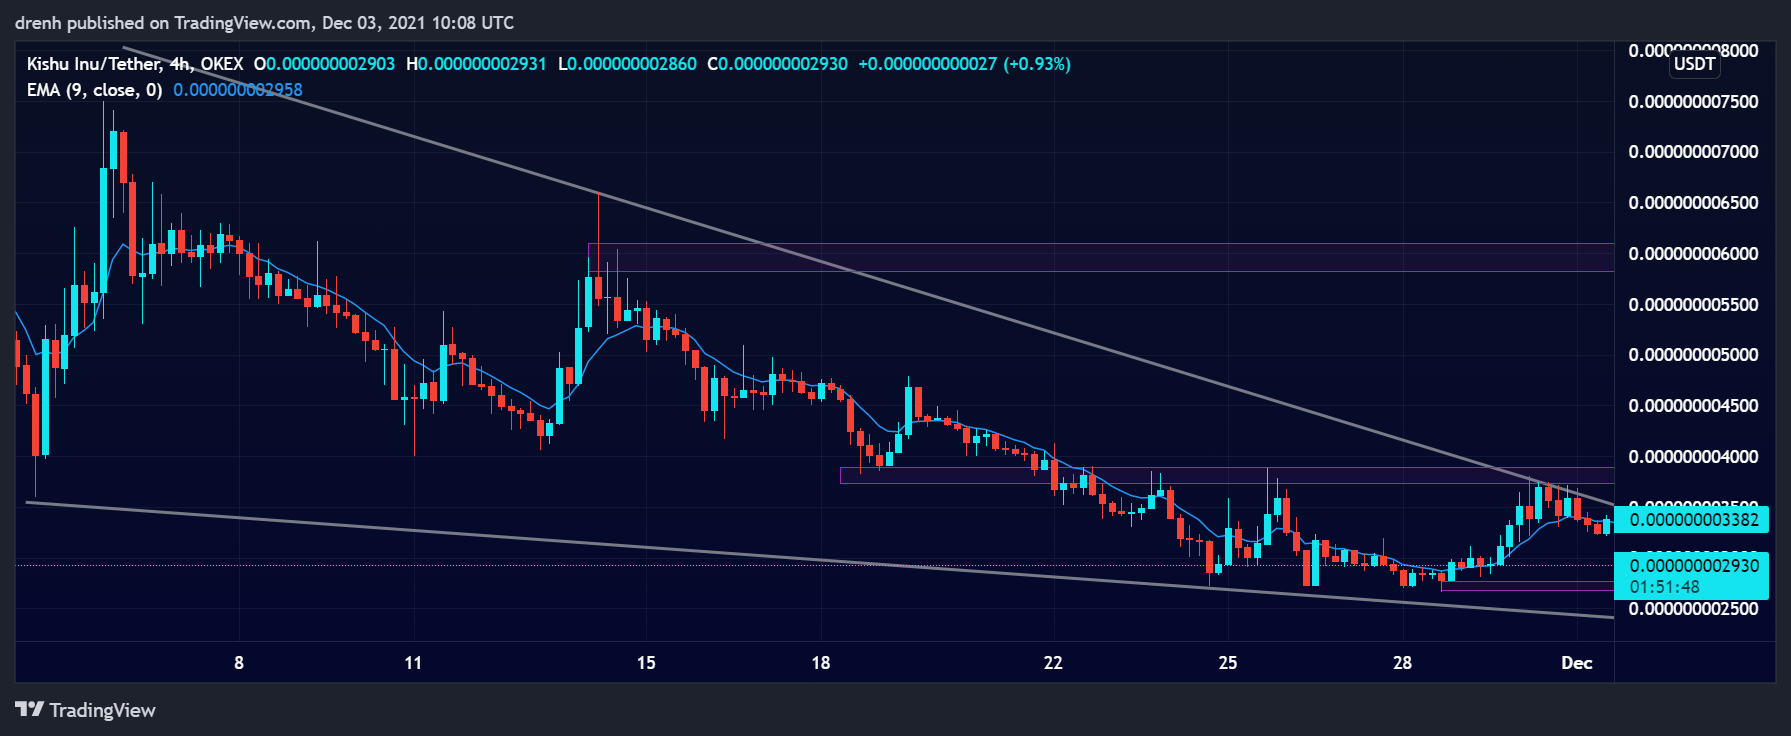
Monthly Analysis
Over the last 30 days, KISHU has been bearish. The price has declined by around 61% in the last few weeks. KISHU is now in a downtrend when looking at a 4-hour chart. The price has recently faced resistance at $0.0000000038, which was always a strong resistance structure before. A descending wedge pattern indicates that a breakout could occur soon for KISHU.

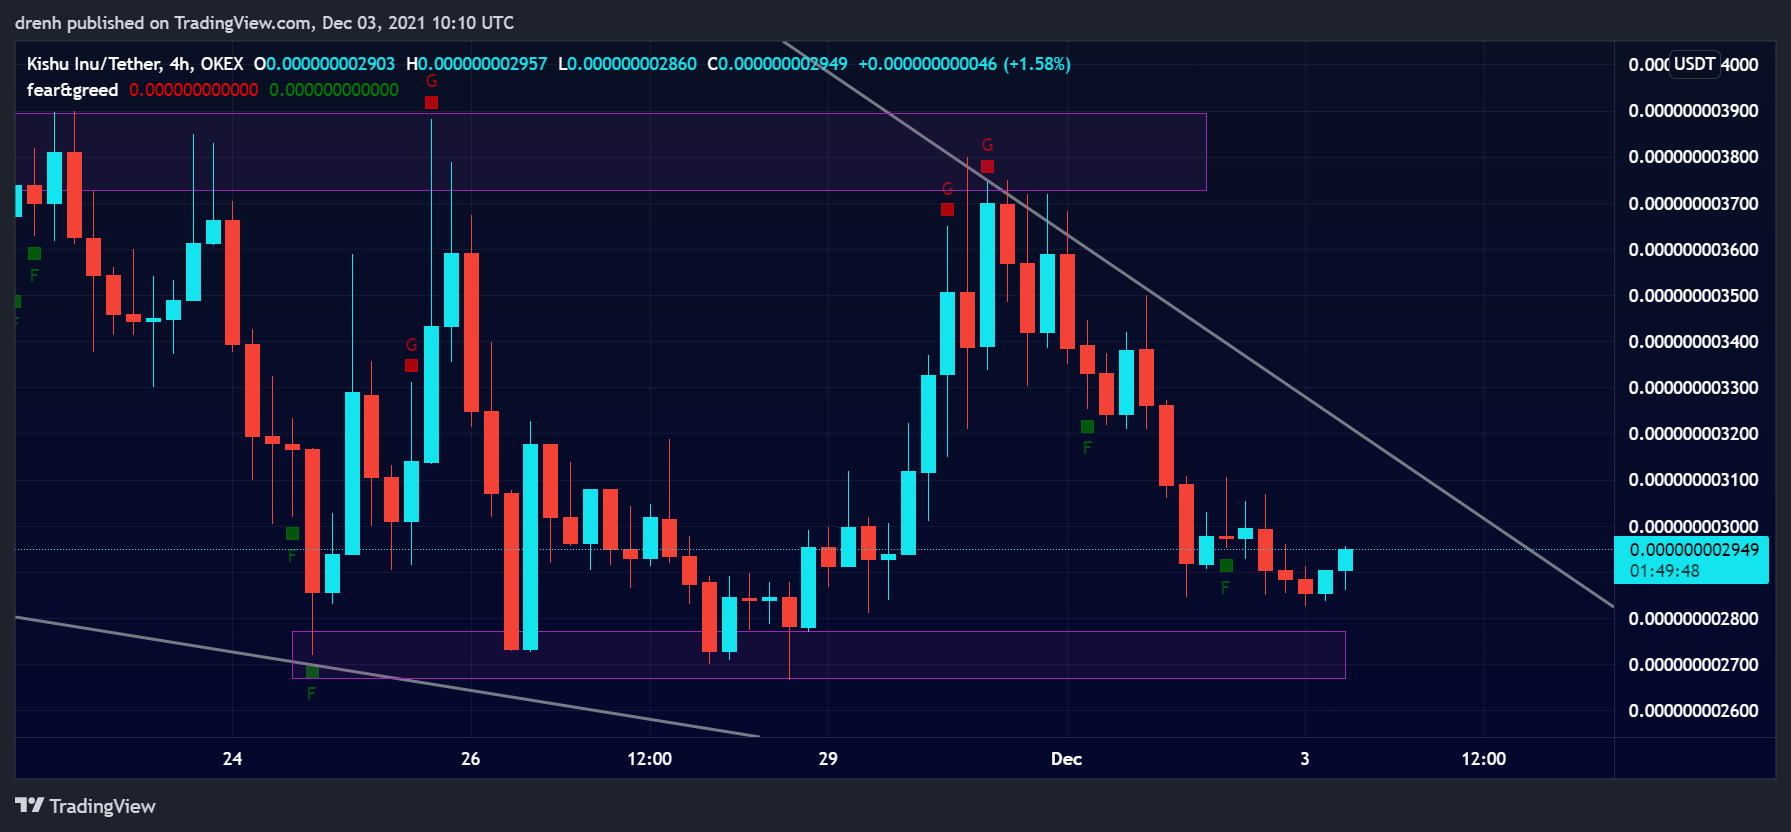
Weekly Analysis
In the last 7 days, KISHU initially increased by 46%, hinting at a possible reversal, but resistance at $0.0000000038 stopped the price from continuing upward. The price is now retracing again, and it has retraced by 23% so far.
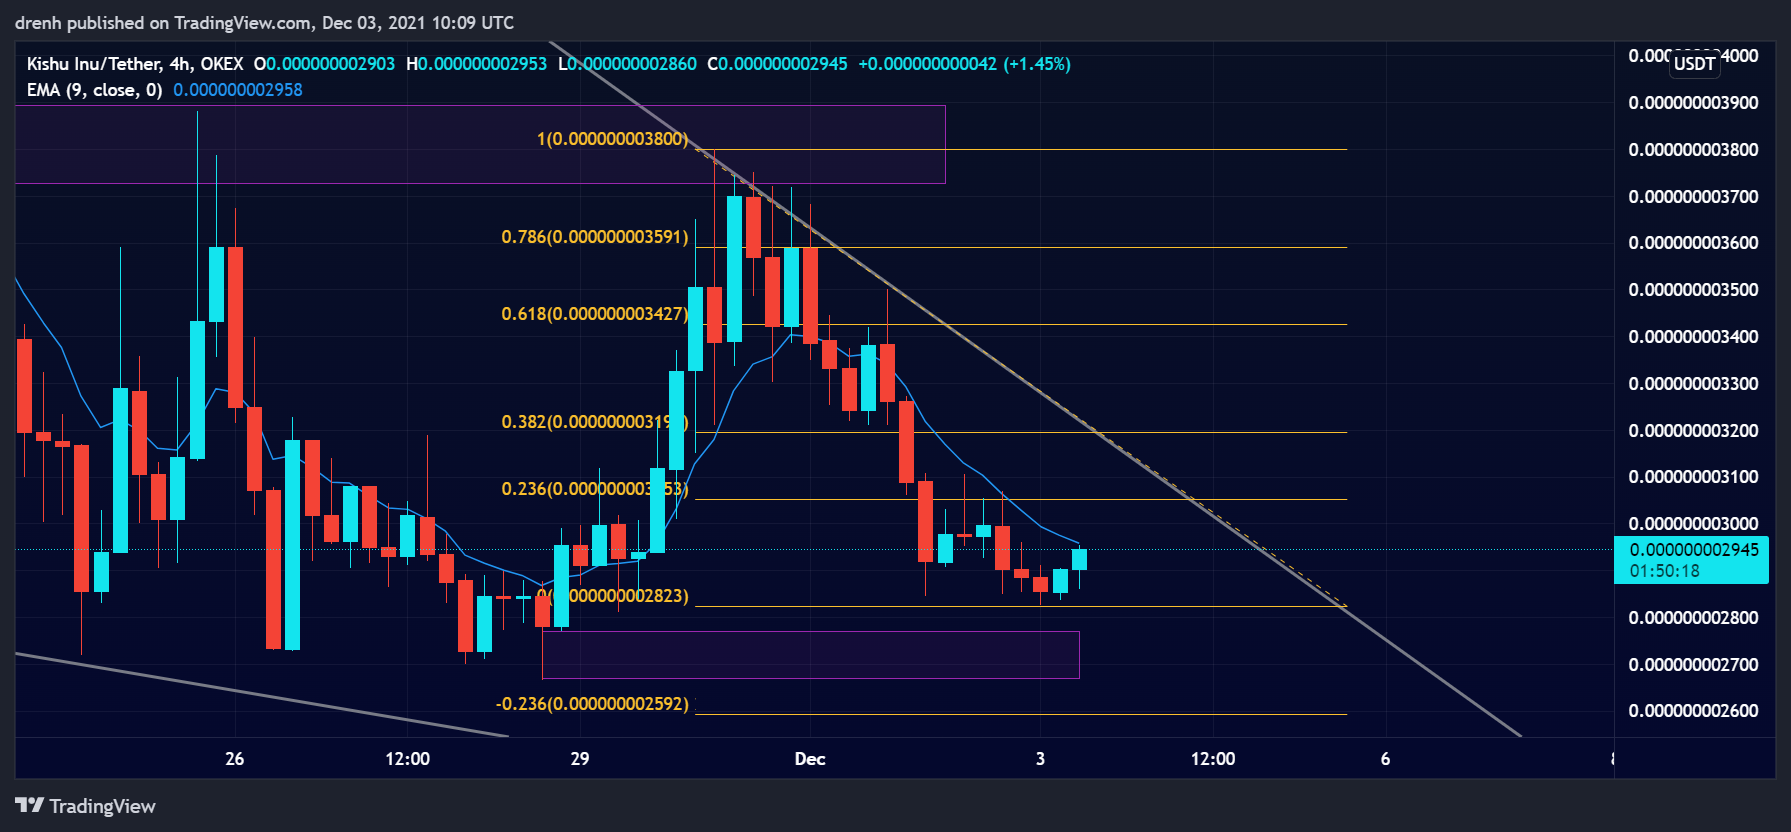
Daily Analysis
In the intraday chart, KISHU has been in consolidation, and the price remained highly volatile. Nonetheless, the price has shown bullish signs in the intraday chart, indicating that the price could increase in the coming hours.
Key Structures
Support
- $0.0000000027
Resistance
- $0.0000000038
Indicators
Moving Average
The 20-moving average of a 4-hour chart is above the price of KISHU, indicating that the current trend is still facing downward and that the price of KISHU could keep declining in the coming days.
The 9-EMA is slightly above the price of KISHU, meaning that the price could resist going upward due to the EMA line. However, recent bullish tendencies suggest that the EMA line could move below the price soon.
Volume
The trading volume in a 4-hour chart is slightly declining as the price is in a retracement. This could see the price of KISHU have another surge upwards if buyers take over.
MACD
The MACD line is below the signal line in a 4-hour chart, indicating that the momentum for Kisha Inu is bearish and that the price could keep declining.
Fear & Greed
The fear and greed indicator of a 4-hour chart suggests that the current emotion of KISHU traders is fear due to the recent price decline.

Fibonacci
The Fibonacci retracement levels suggest that if the price of KISHU is currently facing support, then it could soon encounter resistance at one of the Fibonacci levels. The 61.8% level was previously respected, so the same could occur again for KISHU.
Price Prediction KISHU – December 2021
Based on this technical analysis of Kishu Inu (KISHU), we could see its price increase in the short run before it faces resistance again. If the price retraces instead, then a double bottom could be formed, which would also lead to a price increase in the short run. As for the longer run, we could see KISHU surpassing $0.000000006 in the coming weeks. A new all-time high is feasible by the end of this cycle.
Latest News for KISHU – Affecting Price
Elon Musk has recently reaffirmed his support for Dogecoin, suggesting that transaction costs of DOGE remain the most favorable ones. Such statements can give another boost to all Dogecoin-influenced cryptocurrencies, including Kisha Inu.
Also read: Kishu Inu (KISHU) Price Prediction 2022 and Beyond – Will Kishu Inu Eventually Hit $1?