


HNT Technical Analysis – October 2021
Monthly Analysis
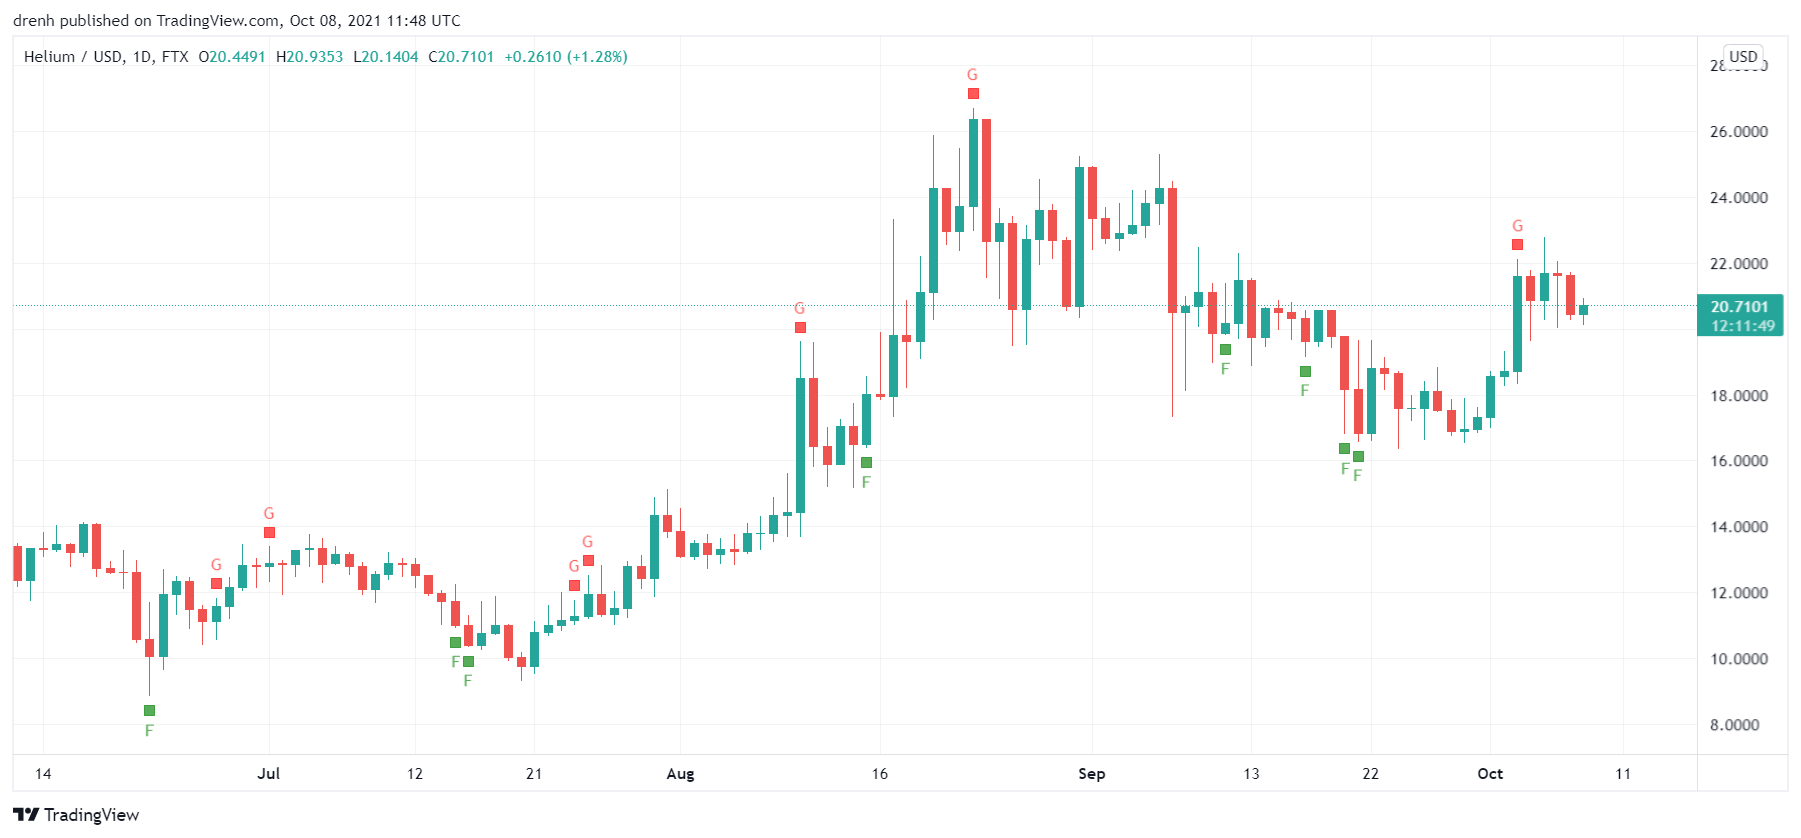
Over the last 30 days, HNT has decreased by 35%. Then, HNT found support at $16.4. After that, the price of HNT started increasing again, indicating another bullish run. The price has increased by around 39% after that.
Weekly Analysis
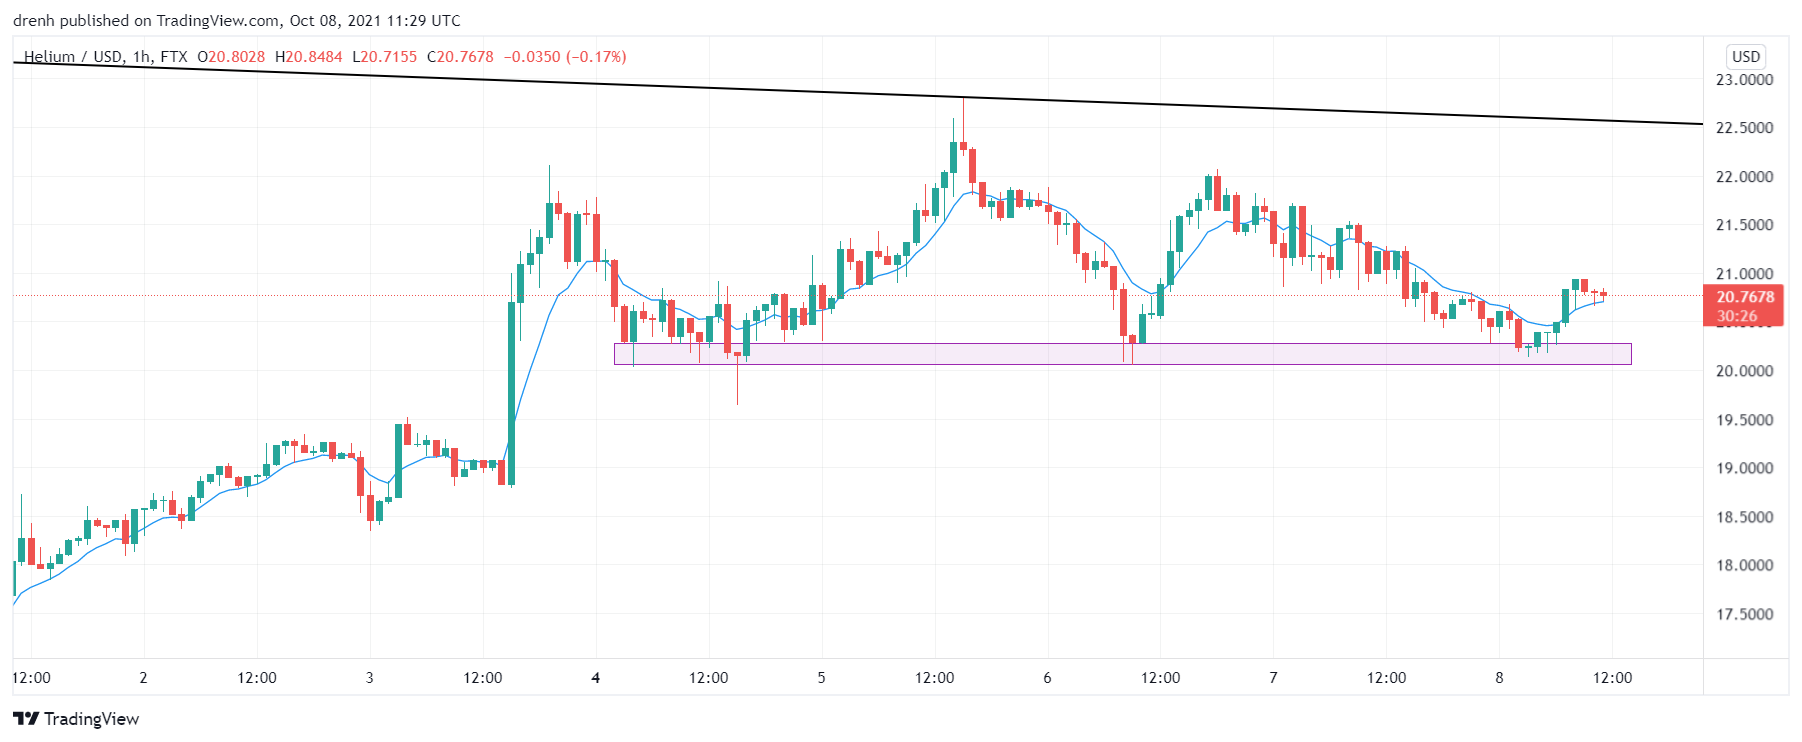
In just the last 7 days, HNT has increased by 34%. Helium then faced resistance at $22.8. The price was supported three times at the same structure, indicating that the buying pressure is high for HNT and that the price could keep increasing in the coming days.

Daily Analysis
Over the last few hours in the intraday chart, HNT has increased by around 4%, indicating that the trend is upward in the shorter run. All the signs suggest that the price of
Key Structures
Support
- $20
Resistance
- $22.8
Indicators
Moving Average
The 20-day moving average is below the price, indicating that the price of HNT could keep increasing in the coming days as the trend is upward.
The 9-day EMA is also slightly below the price of HNT, and it is currently acting as support for HNT, indicating that the trend of Helium is bullish despite the recent pullback.
Relative Strength Index
The RSI of a daily chart is above 50, but still not very close to 70. This indicates that the momentum is bullish and that there is plenty of room for growth in the price of HNT. In a 4-hour chart, the RSI is slightly less bullish.
MACD
In a daily chart, the MACD line is quite above the signal line and above the baseline. This indicates strong bullish tendencies and that the price of HNT could increase in the coming days. As for the 4-hour chart, the MACD line is below the signal line and heading below the baseline, meaning that the momentum is bearish in the short run.
Fear & Greed
The fear and greed indicator in a daily chart suggests that the current emotion of HNT traders is greed, meaning that traders are currently bullish.

Fibonacci
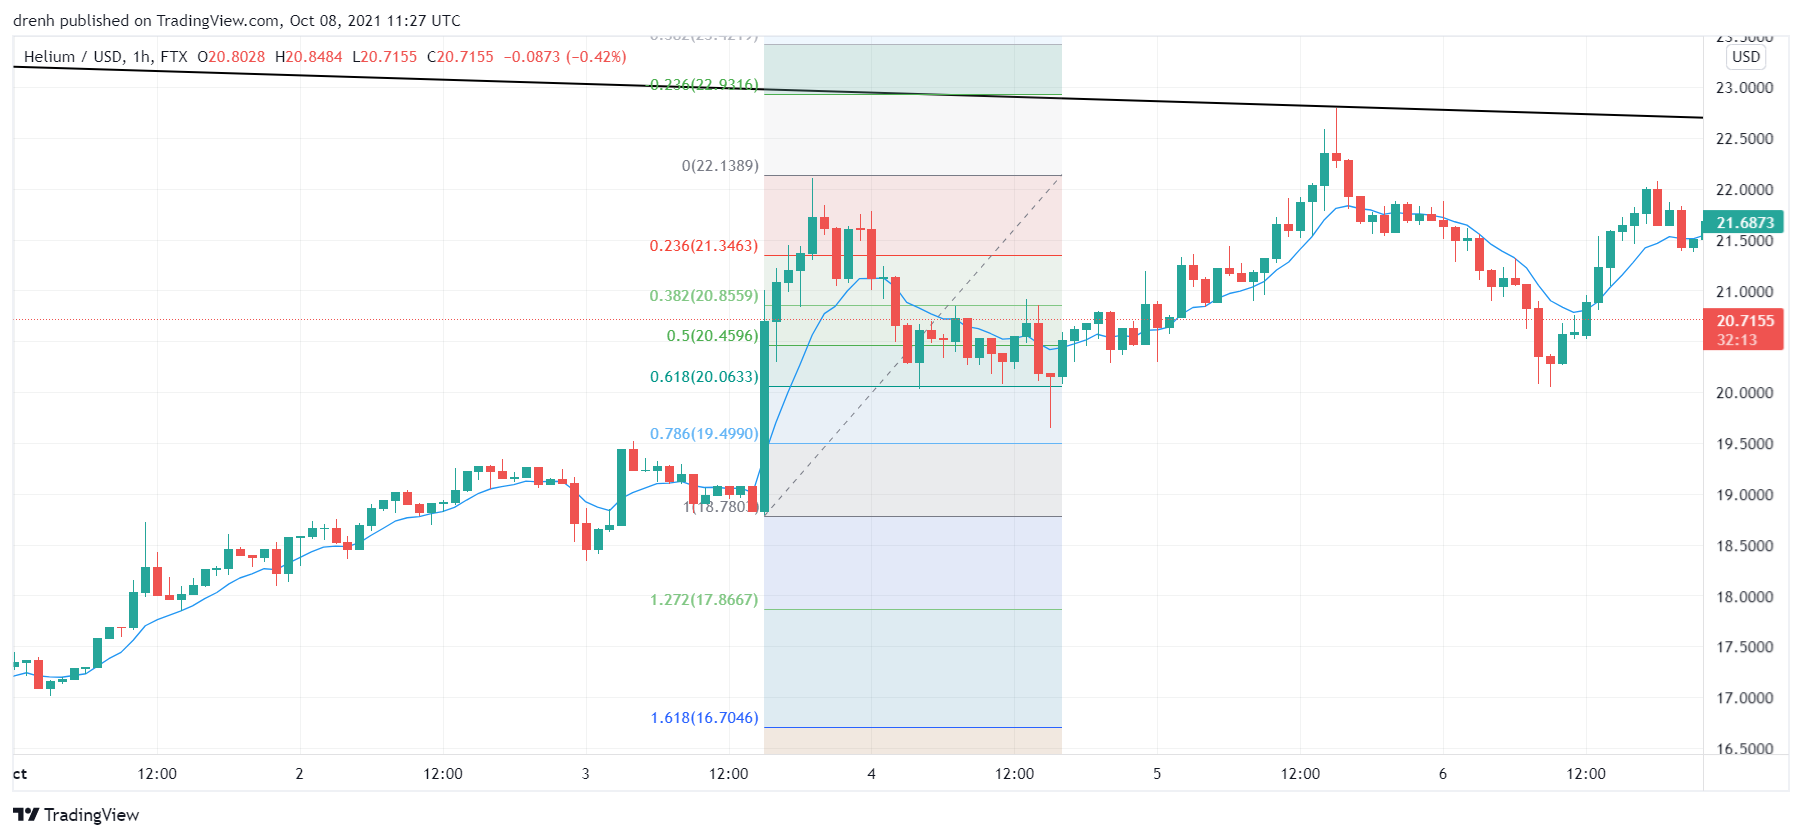
The Fibonacci retracement level at 61.8% was respected by Helium as the price precisely retraced the and then aimed for the 23.6% extension level.

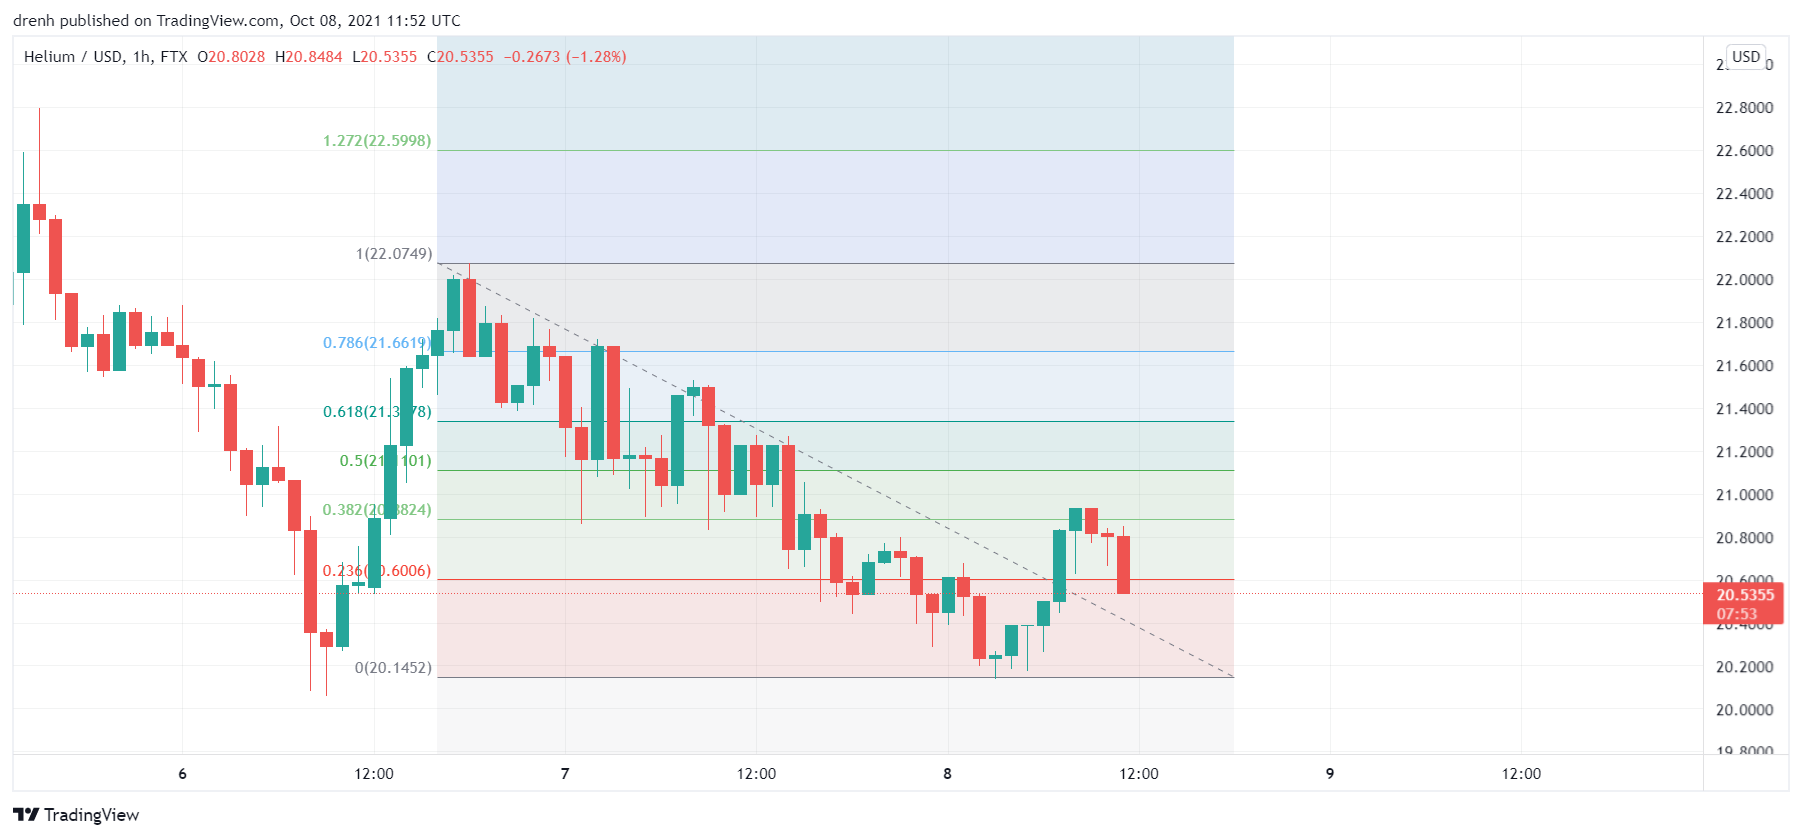
As for the current price movement in a 1-hour chart, HNT has declined but found support at the previously tested structure at around $20. The price has retraced to the 38.2% and faced resistance, meaning that the price could decrease even more in the coming hours if it breaks support at $20.
Price Prediction HNT – October 2021
Based on this technical analysis on Helium (HNT), if HNT retests and breaks resistance at $22.8, then HNT could potentially go and try to break the all-time high at $26.69. If this bullish trend in the market continues at the rate that experts projected, HNT could eventually reach $100. If not this month, then in the coming months of this quarter.
Latest News for HNT – Affecting Price
The city of San Jose in California has recently announced that Helium is going to install miners in the city and use the funds to help out around 1,300 households in the city to pay internet fees. Such activity can greatly affect Helium and increase its community. Consequently, the demand for HNT can increase, which then boosts the price of HNT even higher.
Also read: Helium Price Prediction 2021 and Beyond – Is HNT a Good Investment?