

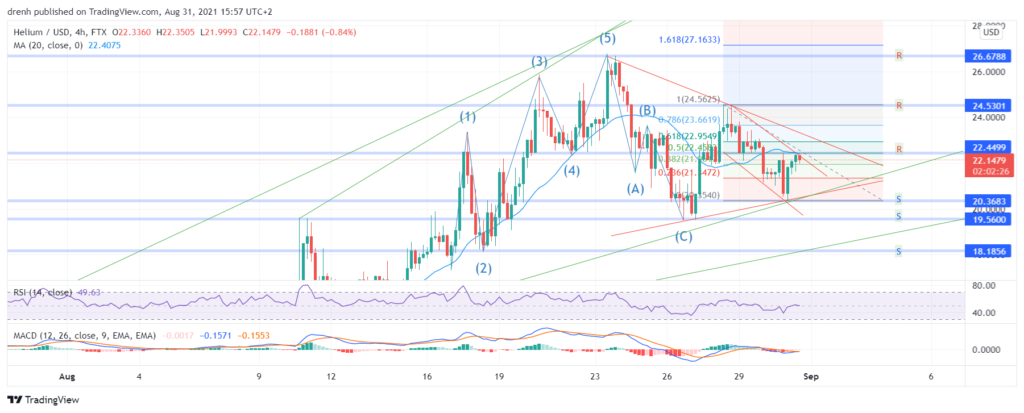
HNT Technical Analysis – August 2021
Daily Analysis
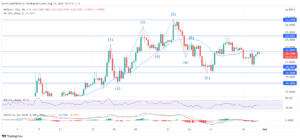
On August 23, HNT reached its all-time high at $26.7 after an astonishing 185% increase in just one month. After every new high, there is a dip in the price, and now HNT is trading at around $21.8. The trend is now downwards, and HNT might be bearish in the coming weeks unless it finds support at tested structures.
Intraday Thoughts
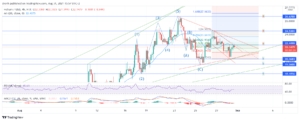
The intraday chart of HNT suggests that the recent correction could test resistance at $22.4, and the following hours can prove to be the turning point for HNT as it may continue to increase again.

Key Structures for Helium
Support
- $20.3, $19.5, $18.2.
Resistance
- $22.4, $24.5, $26.7
Indicators
Moving Average
The 20-day moving average is just below the price as it attempts to support the current price movement of HNT. As suggested, the coming hours of HNT might be crucial for determining if the trend might continue or reverse.
The 9-day moving average is above the price, indicating that the selling pressure is higher in recent days. This MA aligns with the previous high at $22.4 to act as resistance for the short-term of HNT.
Relative Strength Index
The RSI is at 55, and it has increased slightly in the last couple of days, marking the recent price correction. This RSI suggests both bullish and bearish possibilities.
MACD
As for the MACD, the momentum has shifted and now is heading below the baseline as the signal line has surpassed the MACD line. This is another indication that HNT is bearish at the moment, and its price might continue to decline in the upcoming days.
Fibonacci
Drawing the Fibonacci retracement from HNT’s highest of all-time to its previous low, we can notice the 50% level at the previous resistance at $22.4. Going past this level might indicate the start of a new uptrend, even though the 61.8% might be another barrier for HNT.
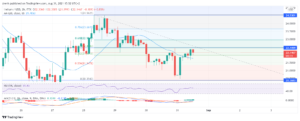

Head And Shoulders
In a 2-hour chart, we can also notice a head-and-shoulders pattern forming recently for Helium. Since the neckline support has been broken, then HNT might be looking to go down even further.

Elliot Waves
The previous uptrend that peaked at Helium’s all-time high also formed Elliot waves. As expected, these waves were then followed by correctional waves, and now the trend is descending for Helium.

Price Prediction Helium – August 2021
Based on this technical analysis, the price of Helium can go further down if it finds support at $22.4 The first support structure can be key for Helium to reverse the trend as a double bottom might be formed and HNT can aim for at least $24.5. If not, then HNT might be bearish and go further down and below $20.
Latest News for Helium – Affecting Price
One of the reasons for Helium’s recent price increase was presumed to be the network’s node count. As it expanded, the price of HNT also increased. Moreover, the token sale worth $111 million on August 10 played another huge role in this recent price increase of HNT. Such correlations with Helium’s price could prove to be similar and useful in the future.
If you want to learn more about Helium (HNT) and its fundamentals, then check out this article:
Helium Price Prediction 2021 and Beyond – Is HNT a Good Investment?