


The queen of cryptocurrency, Ethereum, is going through the biggest change of its history. Ethereum price analysis reveals that the queen saw a sharp fall on the 6th of September following the king Bitcoin, only to stabilize and rise up quickly. While the king took a sweet while to rise past the $19,000.
Ethereum price fell down to the $15,00 mark on the 7th of September only to quickly rise back up to the post-fall levels. The queen is going through the so-called Ethereum merger, where the Ethereum Foundation is shifting the blockchain network from the proof-of-work to the proof-of-stake consensus mechanism.
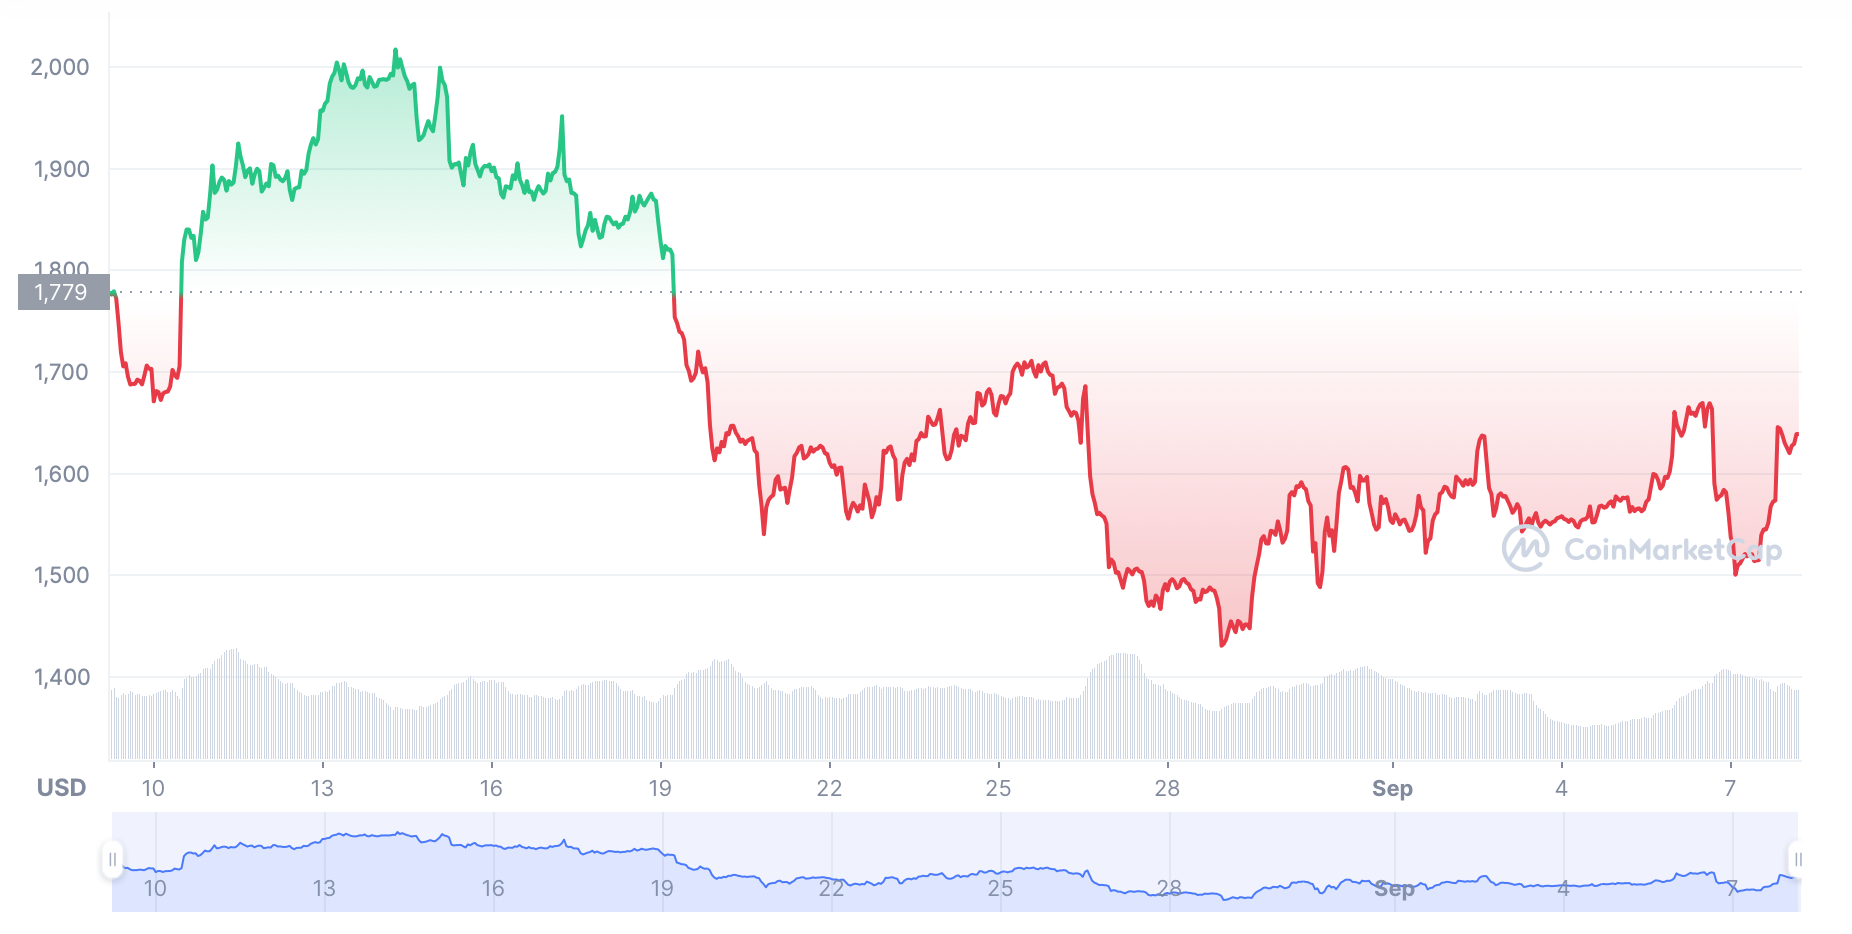
Ethereum Price Chart by CoinMarketCap

The market had a fear fall on 6th September while both the top cryptocurrencies recovered on some level; however, Ethereum transaction volume value fell by 18% in the past 24 hours.
Ethereum Price Analysis: Reverse Head and Shoulder Emerging
A reverse head and shoulder is a bullish indicator, and at the time of writing, the pattern is emerging on the Ethereum price charts. ETH price fell from the $16,74 mark and so far has risen up to the $16,38 mark.
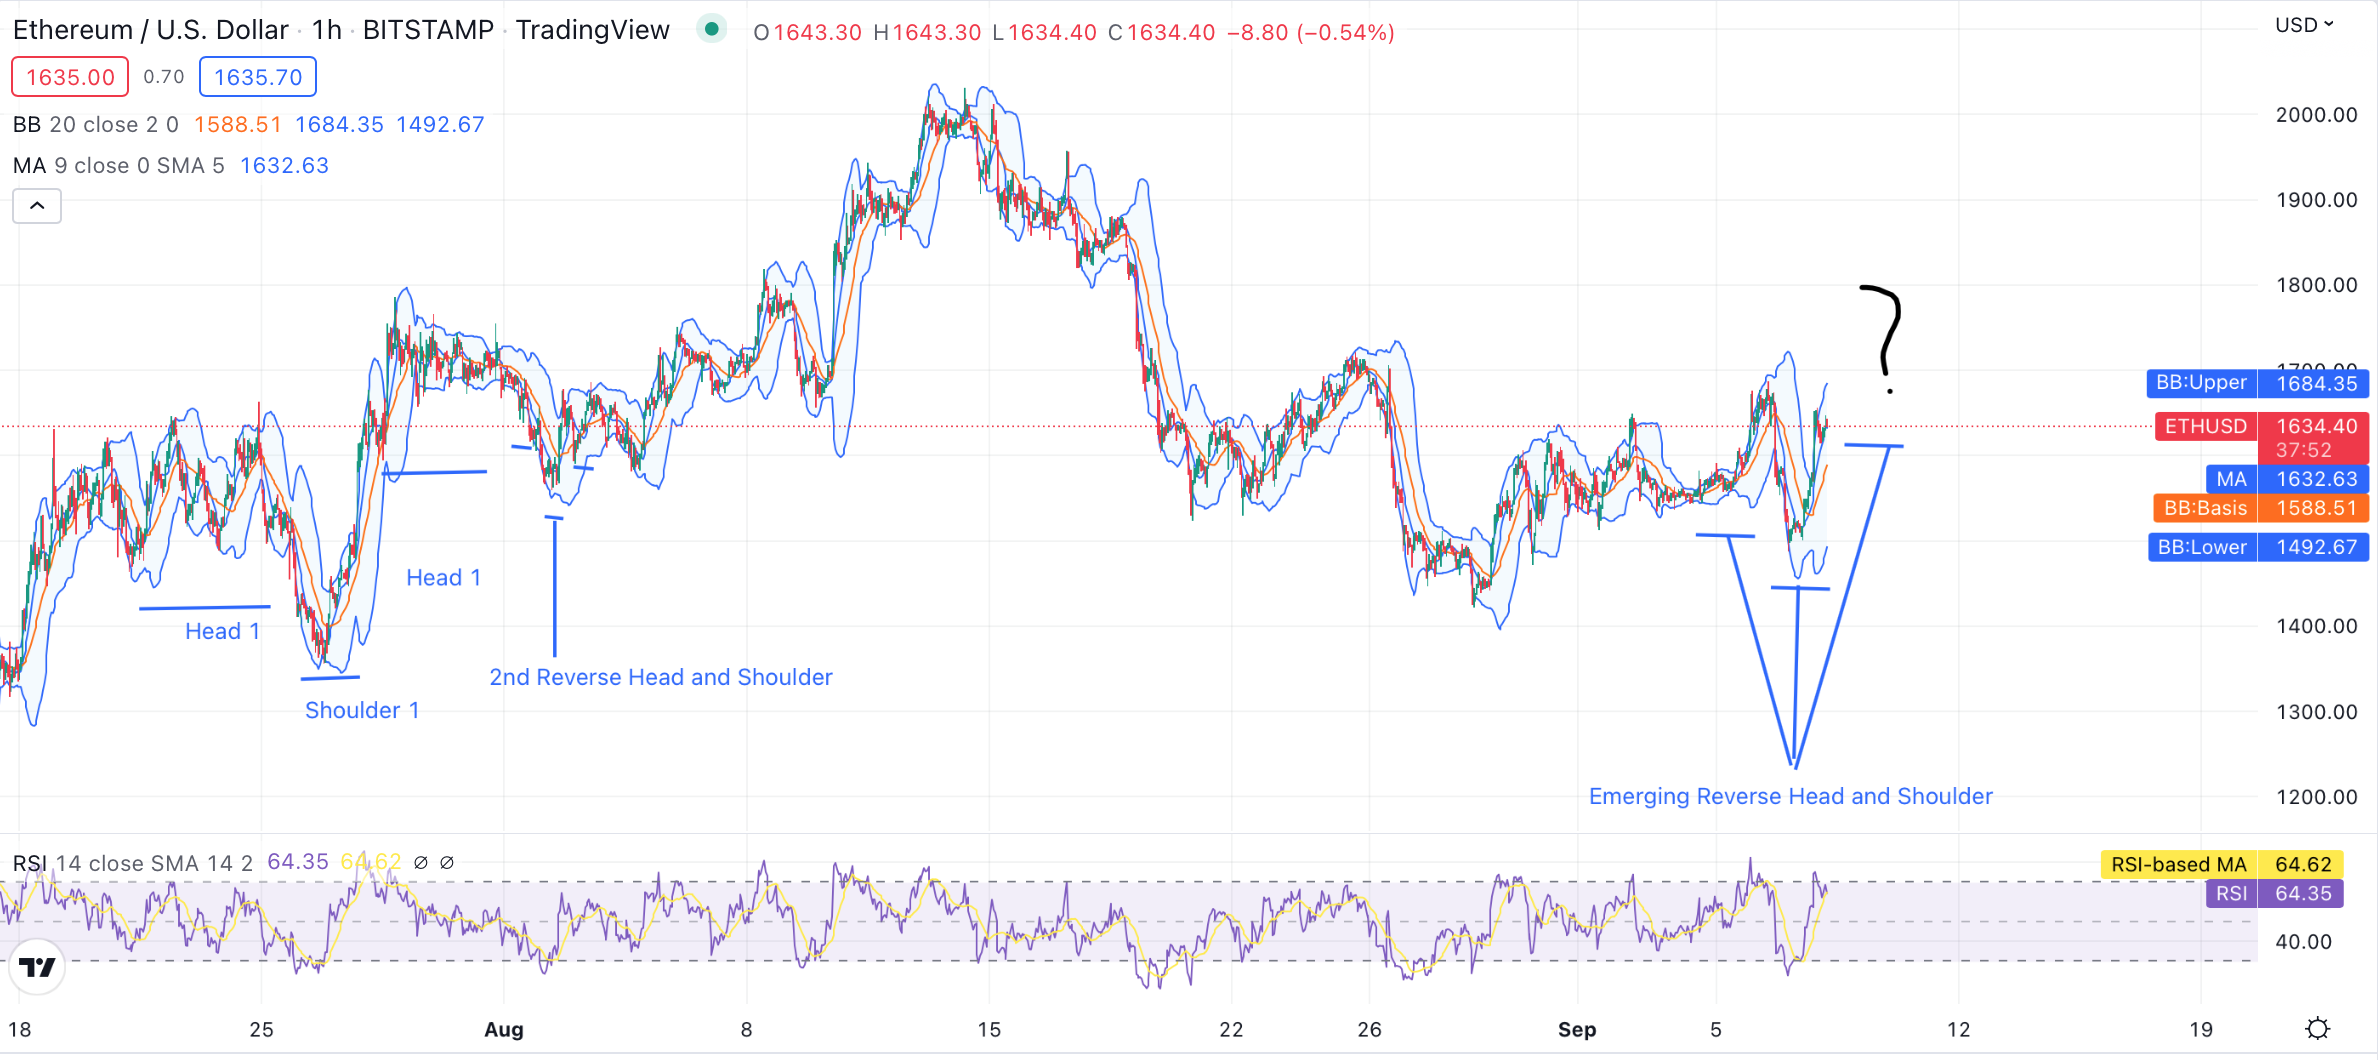
Ethereum price analysis chart made with TradingView

Although the price is now touching the oversold zone on the Relative Strength Index (RSI) chart, the current price movement shows that the cryptocurrency is likely to stay stable within the same price range above the $16,000 mark.
The next phases of the Ethereum merger are due on the 10th and 20th of September. Ethereum price is expected to continue and enjoy a fear of missing out (FOMO) streak until the end of the month, keeping the prices stable.
Ethereum is moving in bullish momentum, with only the Bollinger Bands upper limit serving as the highest resistance point found on the chart at the $1,684 mark. While the RSI score stands at the 64.62 mark, and the RSI moving average stands at the 64.35 mark, leaning towards oversold zones.
The moving average (MA) serves as the first strong support standing at the $1,632 mark on the chart. While the Bollinger Bands’ average (BB: average) stands as the second strong support on the charts standing at the $1588.51 mark. The final indicator Bollinger Bands’ lower limit, serves as the strongest support indicator at $1,492.67.
Although Ethereum is moving in bullish momentum, price sway and volatility is the norm in the market. At present, there is no apparent reason to believe that the cryptocurrency is likely to fall in the next few days or a couple of weeks, for that matter. However, if the cryptocurrency market faces an overall crash, prices can fall to lower levels.
TakeAways
- Ethereum price is stable after a fear fall.
- ETH is moving into a reverse head and shoulder movement, priming for a further rise in the price.
- Stable ETH is likely to keep rising until the end of the month.
- ETH price may sway in case of an overall market crash.
Disclaimer: The information provided on this page is most accurate to the best of our knowledge; however, subject to change due to various market factors. Crypto-Academy encourages our readers to learn more about market factors and risks involved before making investment decisions.