


Bitcoin price analysis reveals that the king of cryptocurrency is facing a sharp drop after a 1996 BTC whale movement, $125 million in liquidation, and massive fear of BTC drop driven by the reports of a possible clamp down on the cryptocurrency in the United States.
Reports of a venture capital $500 million liquidation became a cause for concern coupled with the rumors of a drop-down to the $15,000 to $12,000 range, are driving the prices further down. The total 24-hour trading volume of over $64 billion shows a healthy market movement; however, the possible liquidations are causing massive drops in fear of losses.
🚨 🚨 🚨 1,996 #BTC (37,388,787 USD) transferred from unknown wallet to #Coinbasehttps://t.co/DMPqZJOWIC
— Whale Alert (@whale_alert) September 6, 2022
About $1 billion has reportedly been liquated in the past week alone, including the venture capital trading firm’s $500 million.
Bitcoin Price Analysis: Bitcoin is likely to hit the $20,000 range again
Trading analyst Trading Shot explains that the current price movement is showing a convergence divergence cross-over point due to happen today. The cross-over would allow the king of cryptocurrency to reach the $20,000 mark again.
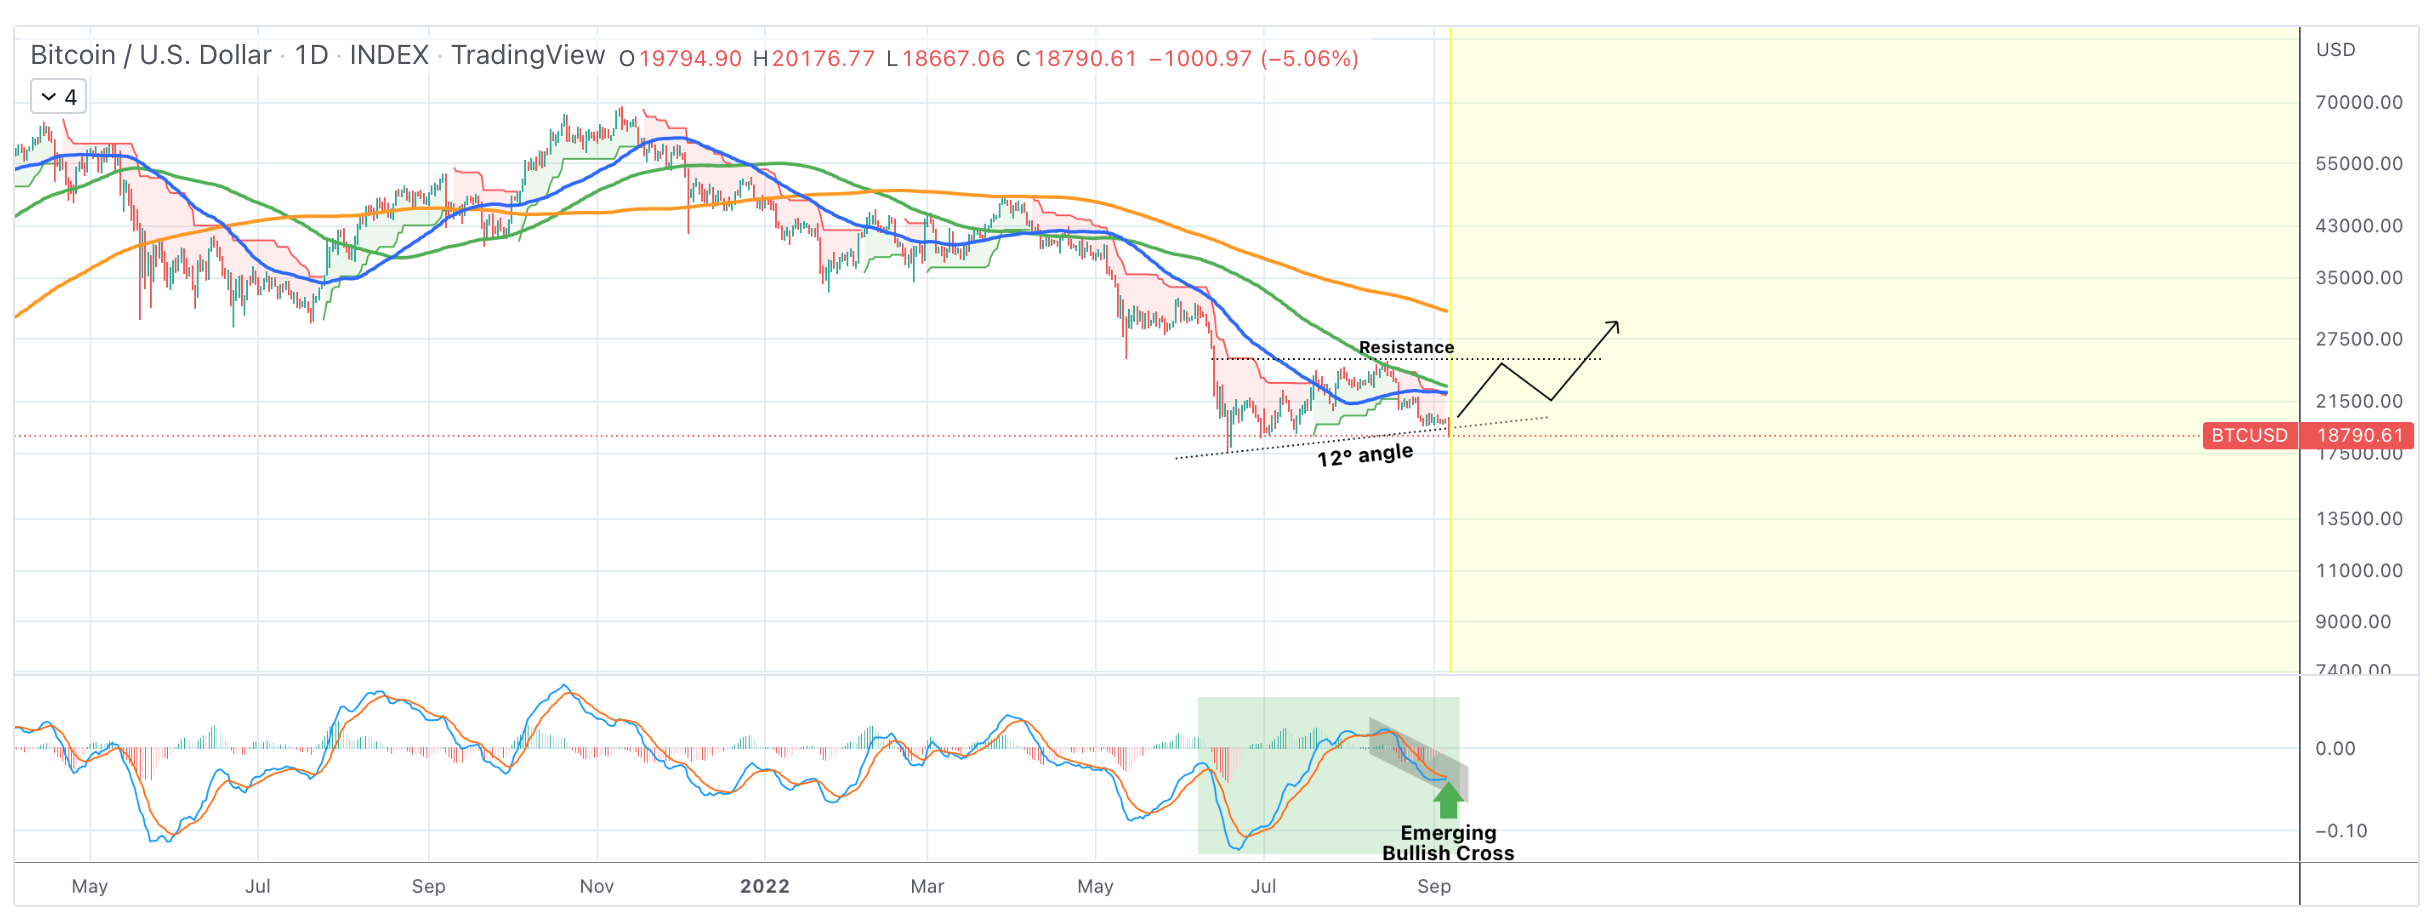

The then-emerging bullish cross was scheduled to take form on the 7th of September, 2022. At the time of writing, the BTC price has hit past the possible low point to $18,713 and emerging back up into the bullish cross.
King of cryptocurrency is likely to hit past $20,000 within the next few days, and the movement is building towards the bullish side. However, another analyst expected the price to fall as low as the $17,000 range before stabilizing.
Bitcoin price analysis: Indicators show stable movement
At the time of writing, Bitcoin’s price stands at the $18,785 mark. While indicators are showing a stabilizing movement for the king of cryptocurrency. Bitcoin price sway within the past 30 days is also evident.
The Relative Strength Index (RSI) shows that the price went to the over-sold zone with the current flash drop; however, it is now stabilizing in the over-sold leaning zone. RSI score stands at the 33.46 mark, while the RSI moving average stands at the 29.84 mark.
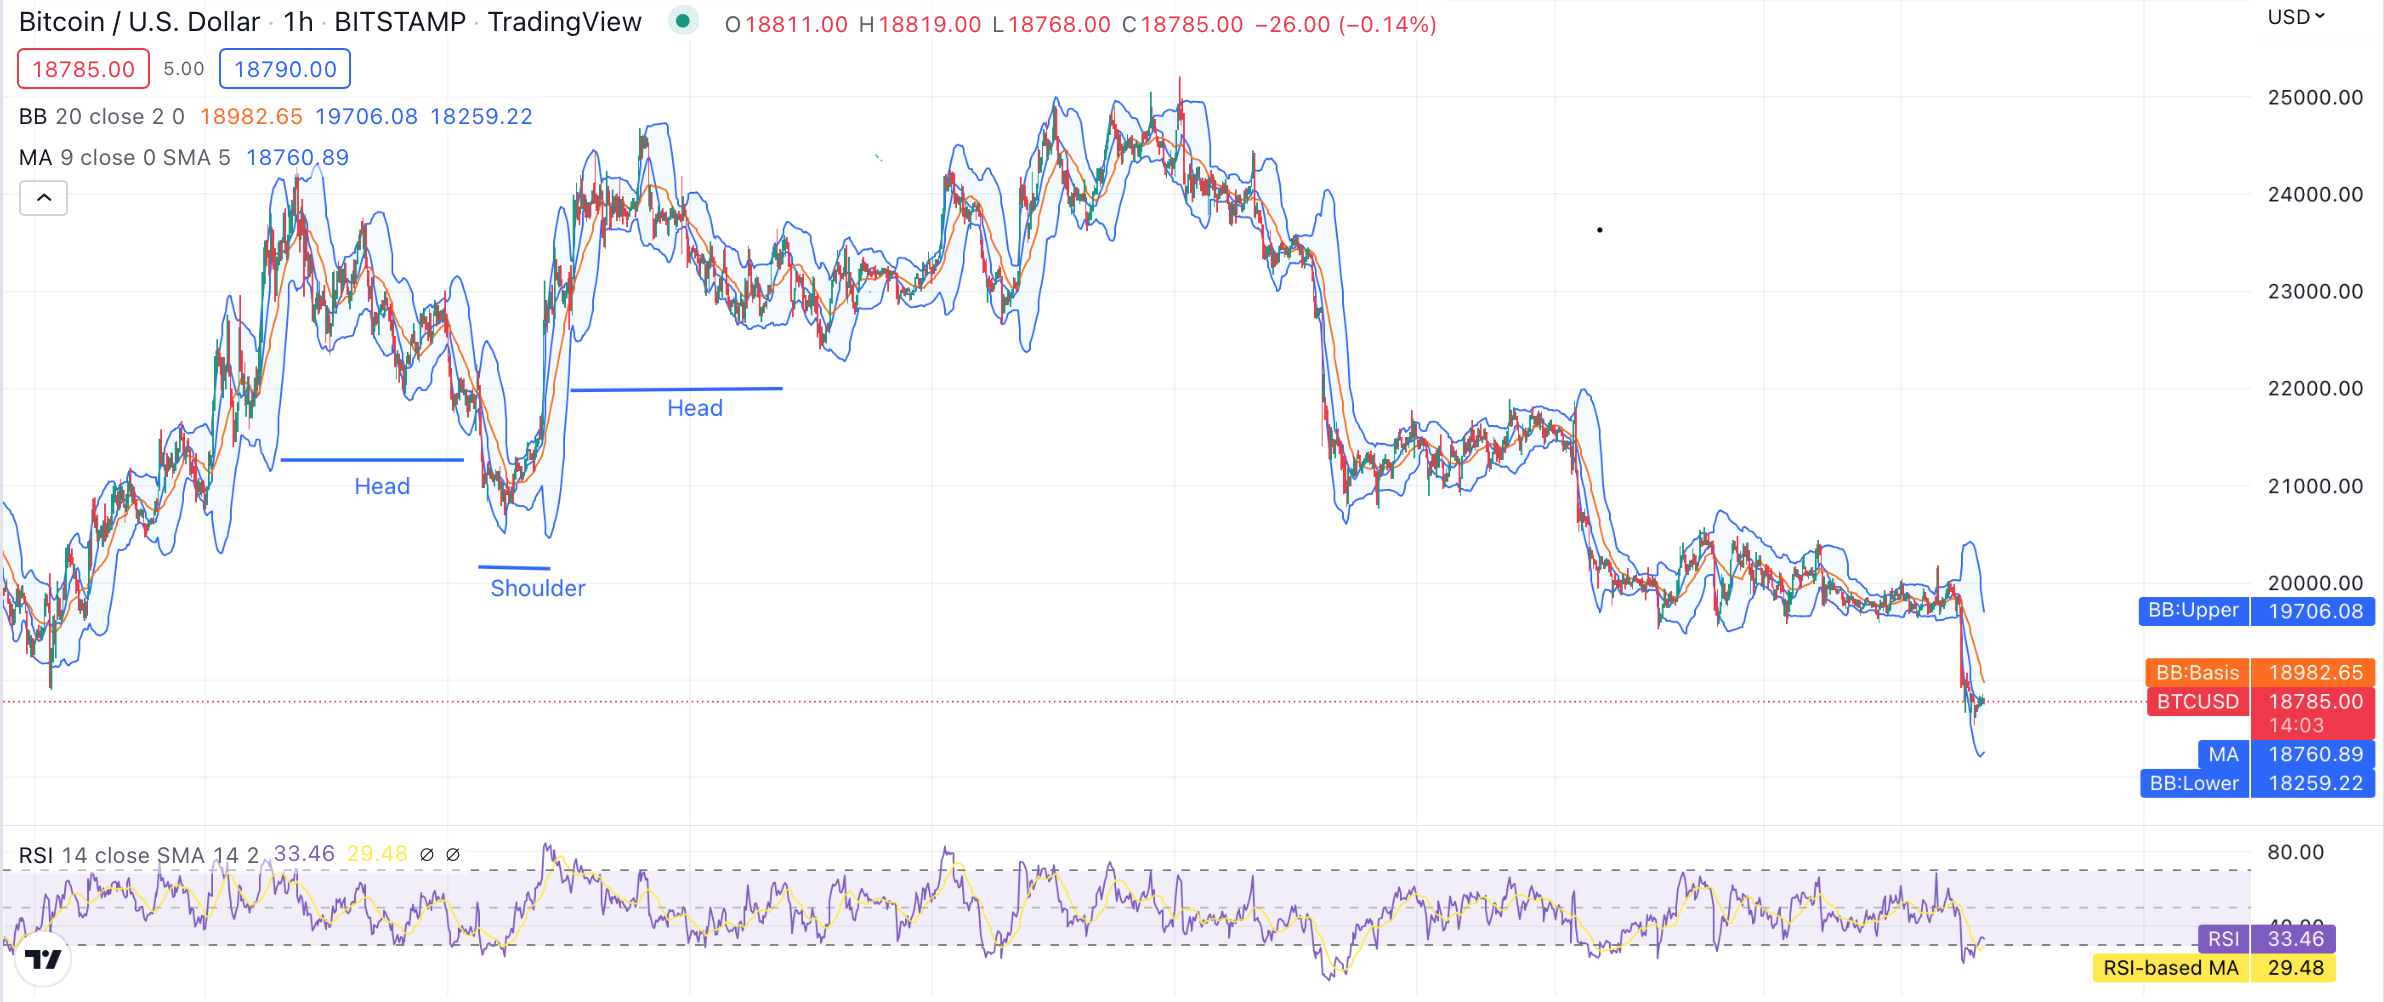
Bitcoin price chart made with Trading View

The price moving average stands at the support point of the $18,760 mark, while the Bollinger Bands’ lower limit serving as the strongest support is found at the $18,259 mark.
On the other hand, the Bollinger Bands’ average (BB: Basis) serves as the strongest resistance point at the $18,928 mark, while the Bollinger Bands’ upper limit at $19,706 serves as the strongest resistance mark.
The fear of missing out is driving traders to invest in newer cryptocurrencies that emerged in the past two years, while the Bitcoin price movement is now tied mostly with the overall market sentiment and the political sway not just in the United States but also the global arena.
Day traders must use caution before making any spot decisions since the price sway is keeping the market in constant turmoil. If the price falls down to the $17,000 mark before the bullish cross emerges, daily traders can lose fortunes.
Disclaimer: The information provided on this page is most accurate to the best of our knowledge; however, subject to change due to various market factors. Crypto-Academy encourages our readers to learn more about market factors and risks involved before making investment decisions.