


OMI Technical Analysis – November 2021
Monthly Analysis
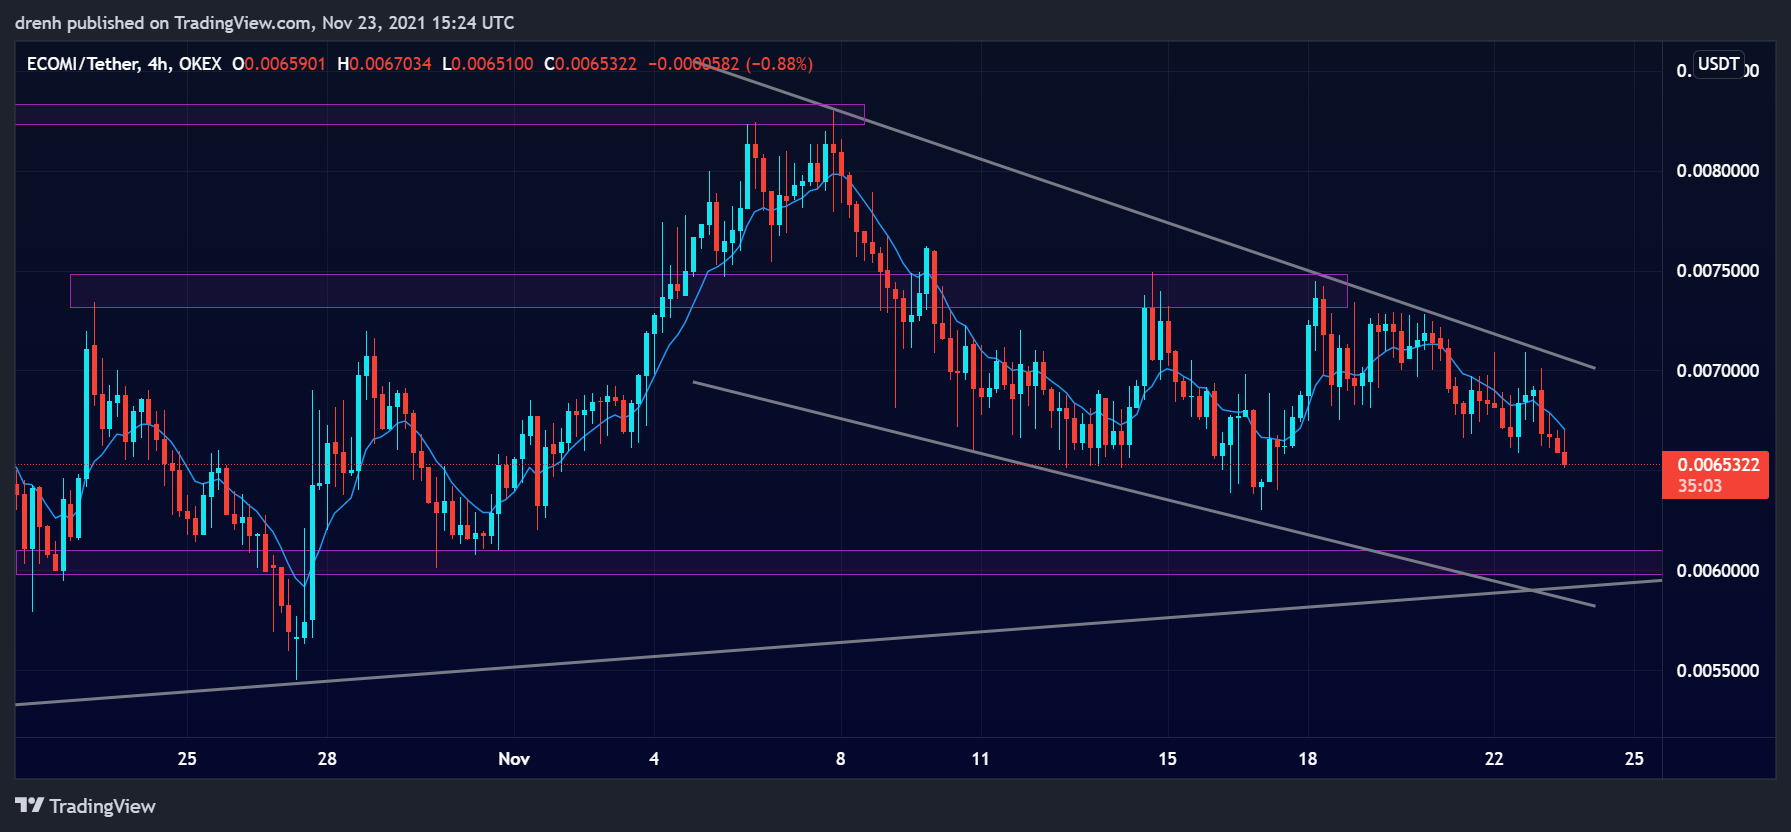
In the last 30 days, OMI initially declined by around 25%. After finding support at $0.0054, the price started increasing again, where OMI reached as high as $0.0083, but it failed to beat previously tested resistance at that range. After this increase of 52%, the price of OMI is now in a downtrend as the price has declined by 24% in the last couple of weeks.

Weekly Analysis
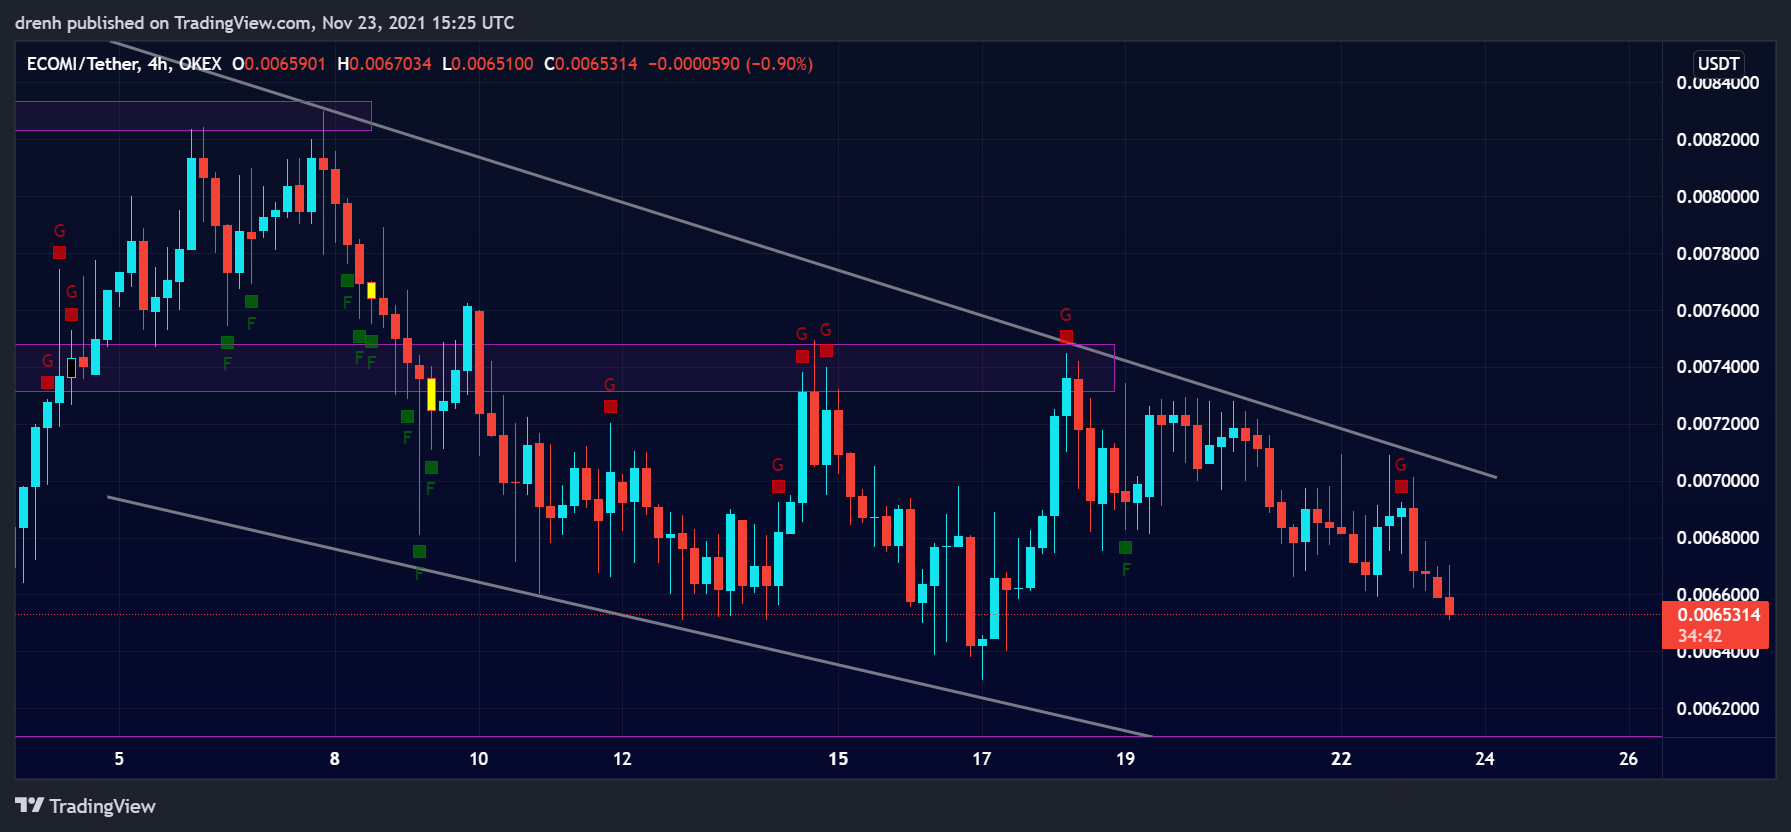
In the last 7 days, the price of OMI had a bullish impulse of 18%, retesting resistance at $0.0074. After that, the price has been declining. It is currently looking to find support before having another correction. OMI is now in a downtrend in the 4-hour chart.
Daily Analysis
In the intraday cart, OMI has been bearish as well. The price has declined by 7% in the last few hours, indicating that day traders are bearish and that sellers have taken over for OMI. The price could soon find support in the coming hours.
Key Structures
Support
- $0.0062
Resistance
- $0.0074
Indicators
Moving Average
The 20-moving average of a 4-hour chart is currently above the price of OMI, indicating that the trend is downward and that the price of OMI could keep declining in the coming days.
The 9-EMA of a 4-hour chart is also above the price due to the recent bearish movement of the price of OMI. This could see the price of OMI decline, and the EMA line could act as a resistance structure to a potential upward movement of the price.
Relative Strength Index
The RSI of a 4-hour chart has been declining due to the recent price decrease of ECOMI. It is slowly approaching 30, and if it goes below that, we could see OMI have another impulse upward.
MACD
The MACD line of a 4-hour chart is currently below the signal line and below the baseline, indicating that the momentum of OMI traders is bearish and that the price could keep declining in the short run.
Fear & Greed
The fear and greed indicator of a 4-hour chart suggests that the current emotion of OMI traders is greed due to the recent bullish impulse. However, it may soon turn into fear as the price has started declining once more.
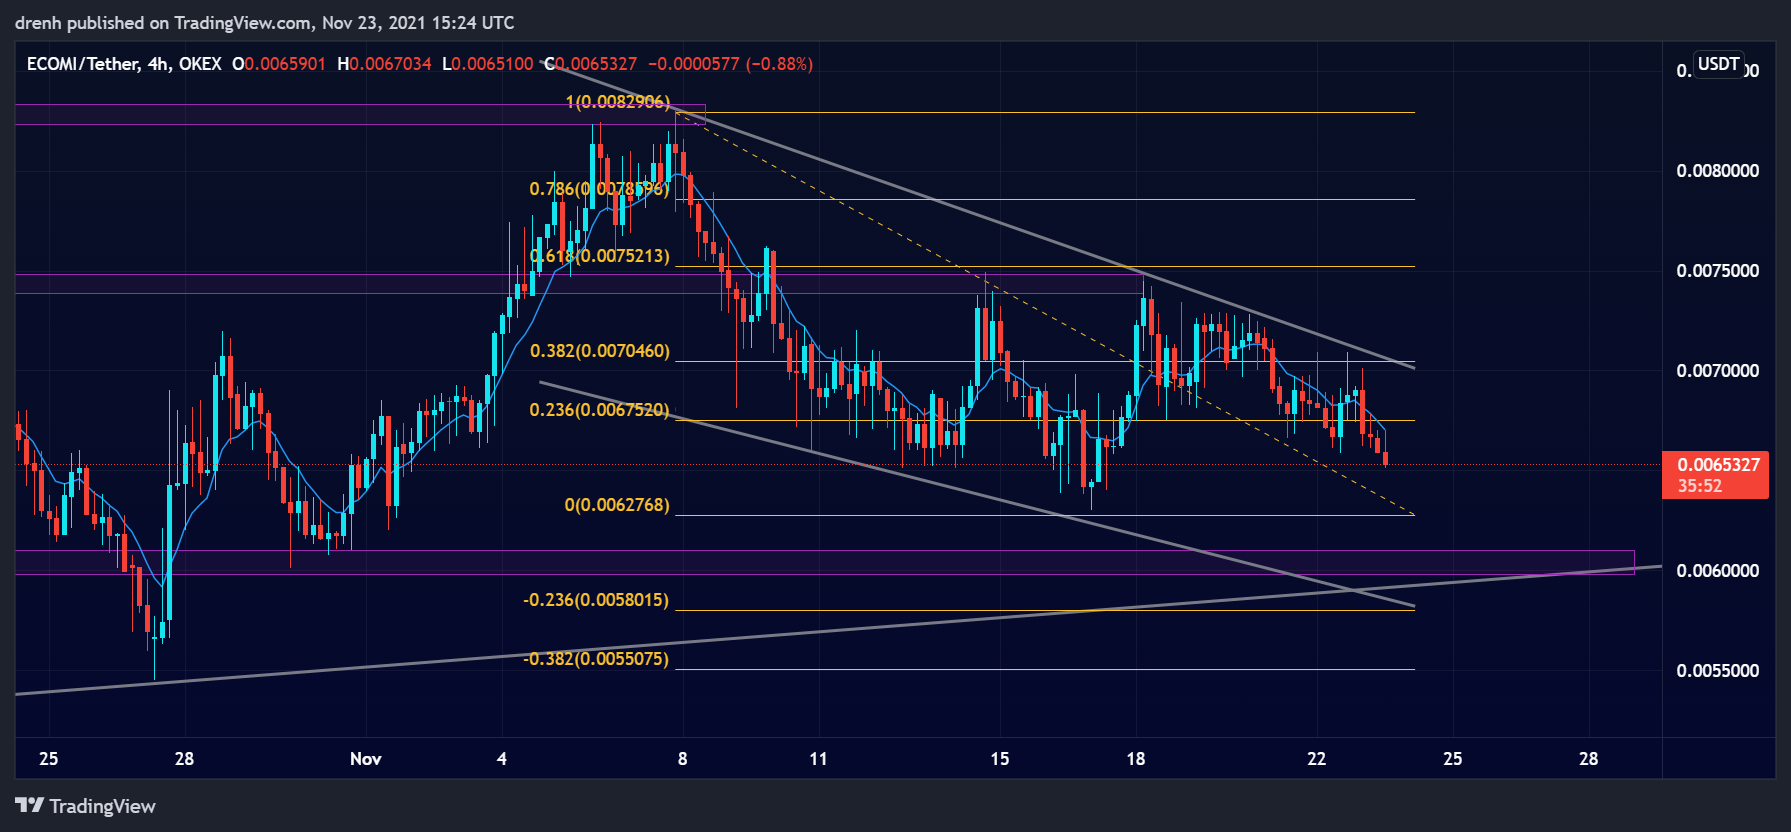
Fibonacci
The Fibonacci retracement levels of a 4-hour chart suggest that the price of OMI retraced to the 61.8% level recently, indicating that the price could head down further down in the coming days. If OMI finds support soon, Fibonacci may not be respected and the trend could even reverse.
Price Prediction OMI – November 2021
Based on this technical analysis on ECOMI (OMI), the price of OMI could keep declining in the short run. It could go as low as $0.0.0058 in the short term. After that, the price could find support and have another upward impulse until the indicators do not suggest that OMI is being oversold. In the coming weeks, if the bull cycle intensifies and BTC maintains its momentum, we could see OMI reach as high as $0.01 as the long-term trend is still upward.
Latest News for OMI – Affecting Price
VeVe, one of the many products of ECOMI, has recently announced a partnership with the US Postal Service. NFT stamps may soon be available through this partnership. This is the first time such a partnership has occurred in the crypto industry. This could give a boost to the price of OMI in the coming weeks.
Also read: ECOMI Price Prediction 2022 and Beyond – Can OMI Reach $1?