

ELON Technical Analysis – January 2022
Monthly Analysis
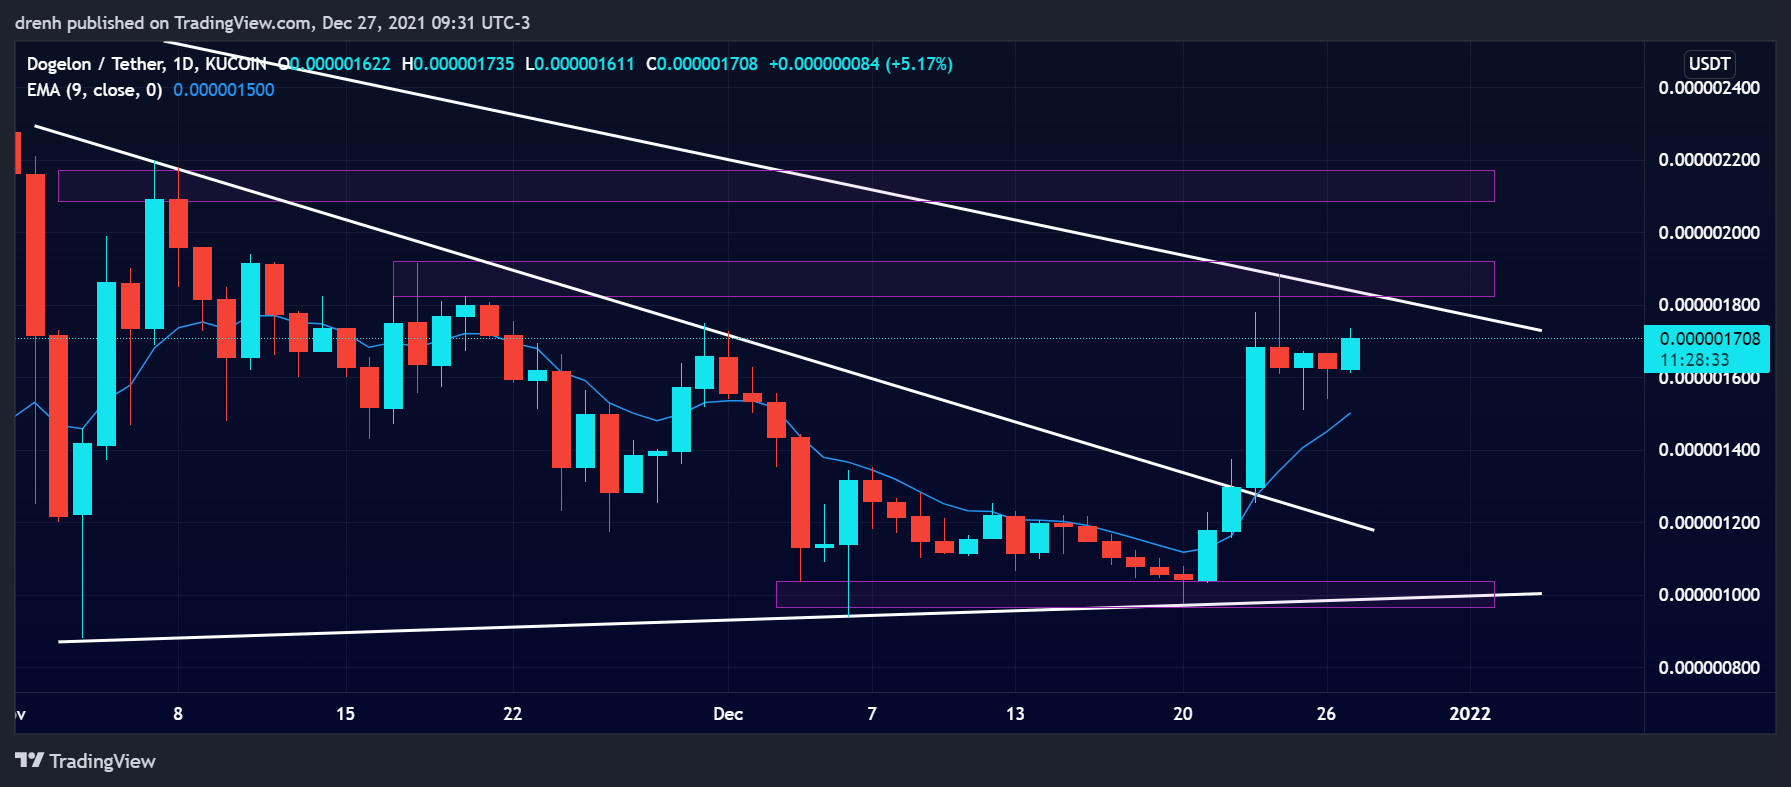
Throughout December of 2021, ELON was generally bearish. The price declined by around 44%. After finding support at $0.0000009, the price had a bullish breakout of more than 90%. This came as a result of a descending triangle pattern that led to this recent breakout. The trend may now reverse as ELON is looking bullish due to the recent price movement.

Weekly Analysis
In the last 7 days, the price of ELON was quite bullish. It increased by around 94%, and it faced resistance at around $0.0000018. The price retraced by around 20% after that, where it found support at around $0.0000015. We could see the price head upward once again in the short run.
Daily Analysis
In the intraday chart, ELON has been relatively bullish. The price has increased by around 7% in the last 24 hours, where the price has shown high volatility. We could expect the price to keep increasing in the coming hours for Dogelon Mars.
Key Structures
Support
- $0.0000013
Resistance
- $0.0000019
Indicators
Moving Average
The 20-MA line of a 1-day chart is quite below the price, indicating that the trend has now reversed and that the price of ELON could keep increasing in the coming days, other things equal.
The 9-EMA of a 1-day chart is also currently below the price, indicating that ELON is now bullish and that the price could keep increasing. The EMA line could act as support if the price attempts to retrace in the short run.
Relative Strength Index
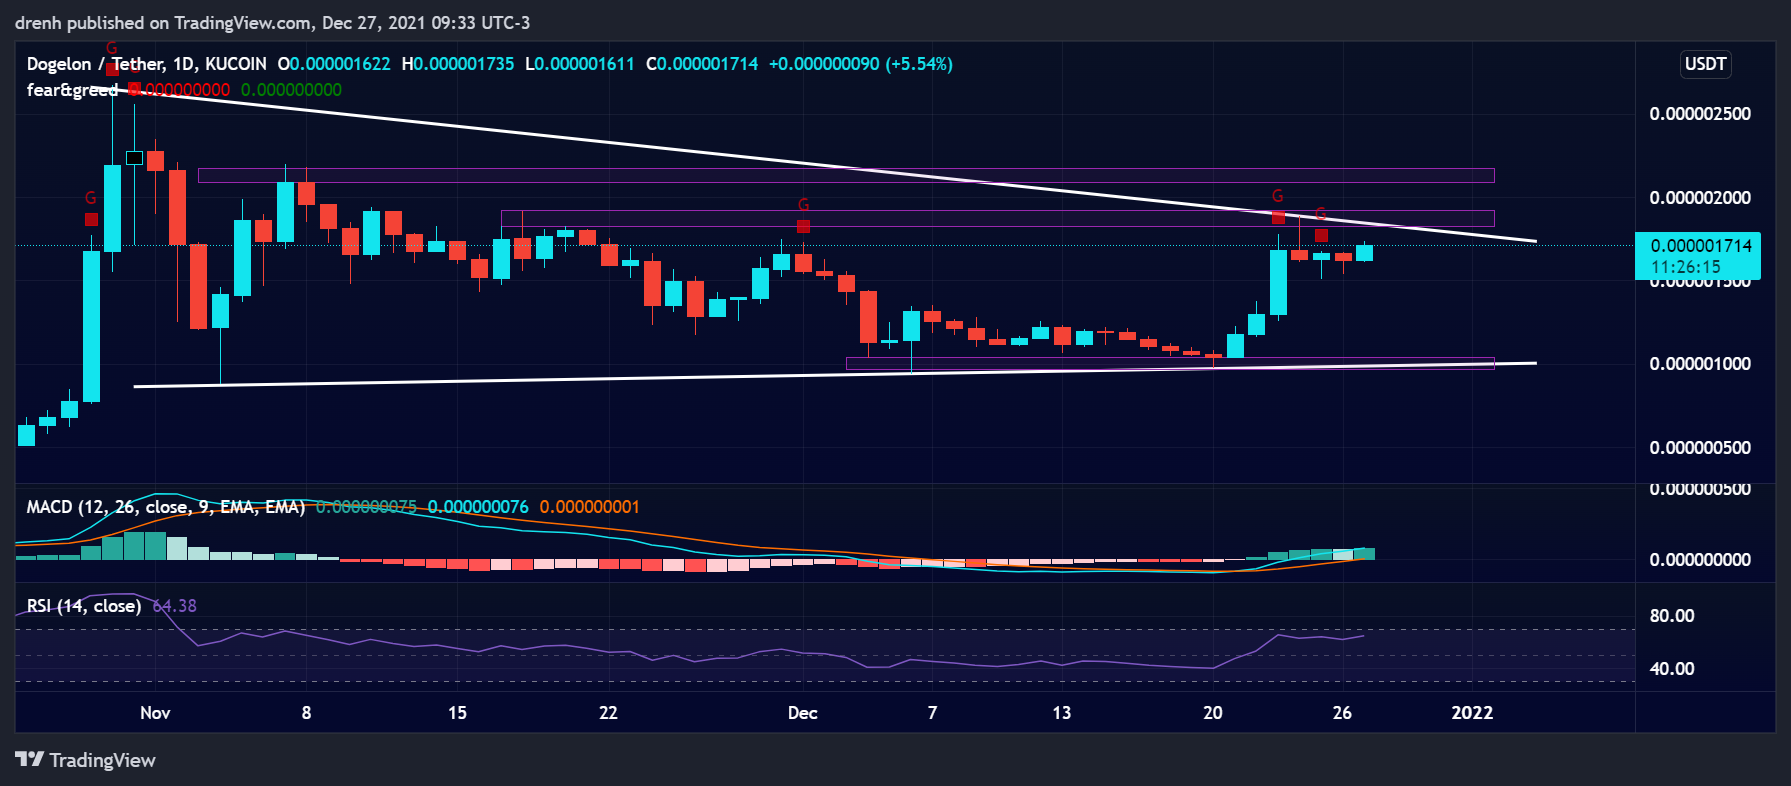
The RSI of a 1-day chart is approaching 70, indicating that ELON could soon be overbought if the price keeps increasing. If that occurs, then we could see the price of ELON have another retracement in the coming days.
MACD
The MACD line of a 1-day chart is now above the signal line and above the baseline, indicating that the momentum is bullish for Dogelon Mars. Despite the recent retracement, the lines have not noticeably converged, indicating that this momentum could continue for ELON.
Fear & Greed
The fear and greed indicator of a 1-day chart suggests that the current emotion of ELON traders is greed, meaning that Dogelon Mars is bullish for the coming days.

Fibonacci
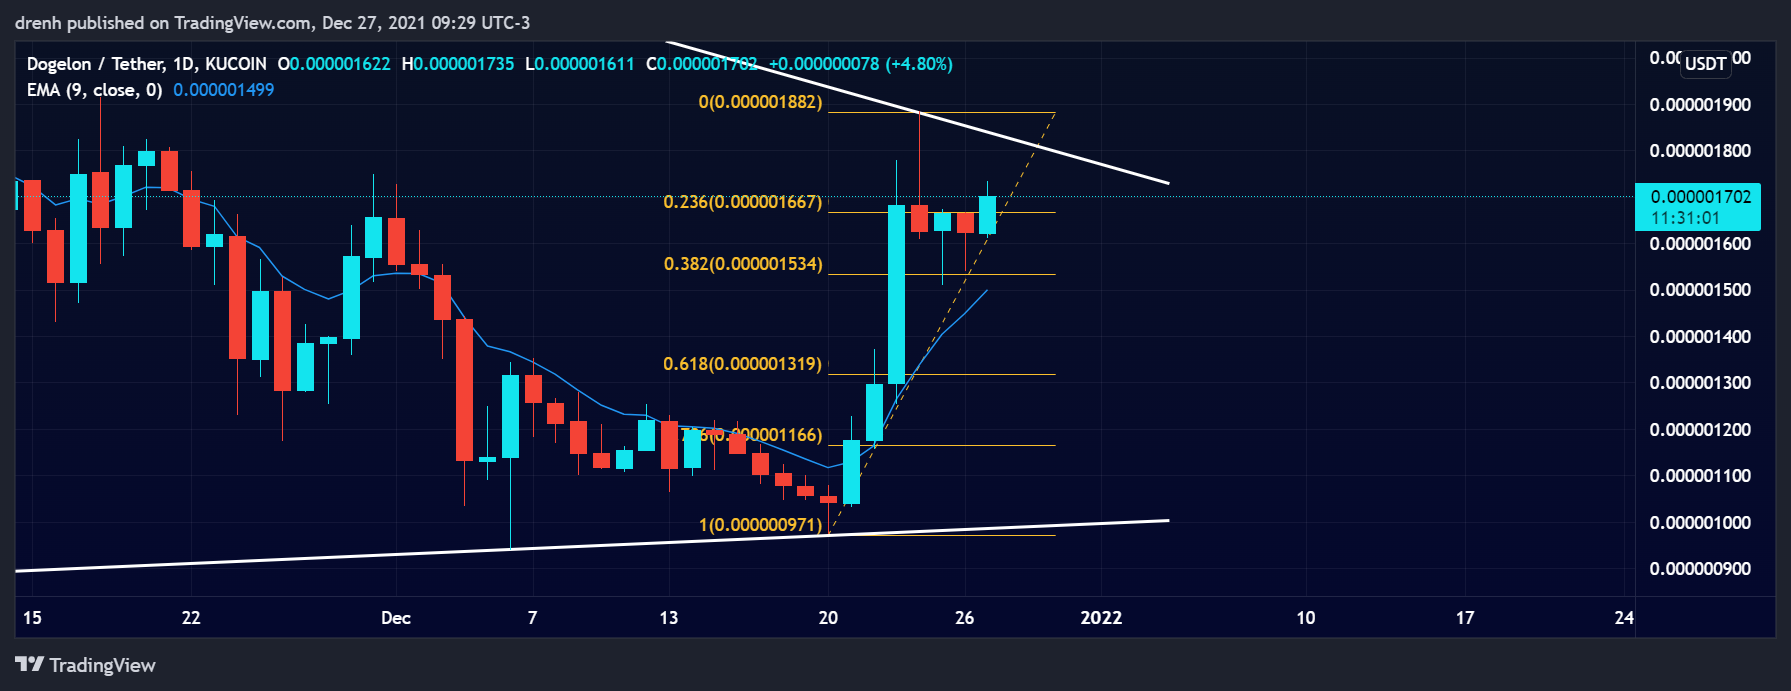
The Fibonacci retracement levels of a 1-day chart suggest that the price of ELON has recently found support at the 38.2% level, meaning that the price could have another surge upward in the coming days. If the price further retraces, then the 61.8% level could be a strong level of support.

Price Prediction ELON – January 2022
Based on this technical analysis on Dogelon Mars (ELON), we could see the price of ELON have another surge upward in the coming days. The price could head above $0.000002, but it could face strong resistance at around $0.0000022. Other things equal, ELON could soon retest resistance at the all-time high if it keeps this momentum going throughout January.
Latest News for ELON – Affecting Price
Recently, both Gemini and Huobi Global have listed Dogelon Mars (ELON) and announced their support for the project. This made ELON much more accessible and led to this recent price increase of ELON. Such news could play a huge effect on the price of ELON throughout January of 2022.
Galactic conquest is not a one dog job.
We’ve come this far with the help of friends we’ve made along the way.
I am honored to call @Gemini and @HuobiGlobal my newest friends, and to welcome them on our mission to Mars.
Join us and together we will reach the stars.💫
— Dogelon Mars (@DogelonMars) December 24, 2021
Also read:
Dogelon Mars Review – Is Dogelon Mars (ELON) a Good Investment?
Dogelon Mars (ELON) Price Prediction 2022 and Beyond – Can ELON Eventually Hit $1?
Dogelon Mars Price Prediction 2025 – How High Will ELON Go?
Dogelon Mars Price Prediction 2030 – What Will ELON Price be in 2030?
How to Buy Dogelon Mars – A Step-By-Step Guide
Where to Buy Dogelon Mars Coin in USA? – The Best Exchanges to Buy ELON in USA