


DOGE Technical Analysis – November 2021
Monthly Analysis
Over the last month, DOGE has been bullish. The price has increased by around 60%, but it then faced resistance at $0.34. After that, the price of DOGE has started declining. Nonetheless, DOGE is still bullish in the longer term.
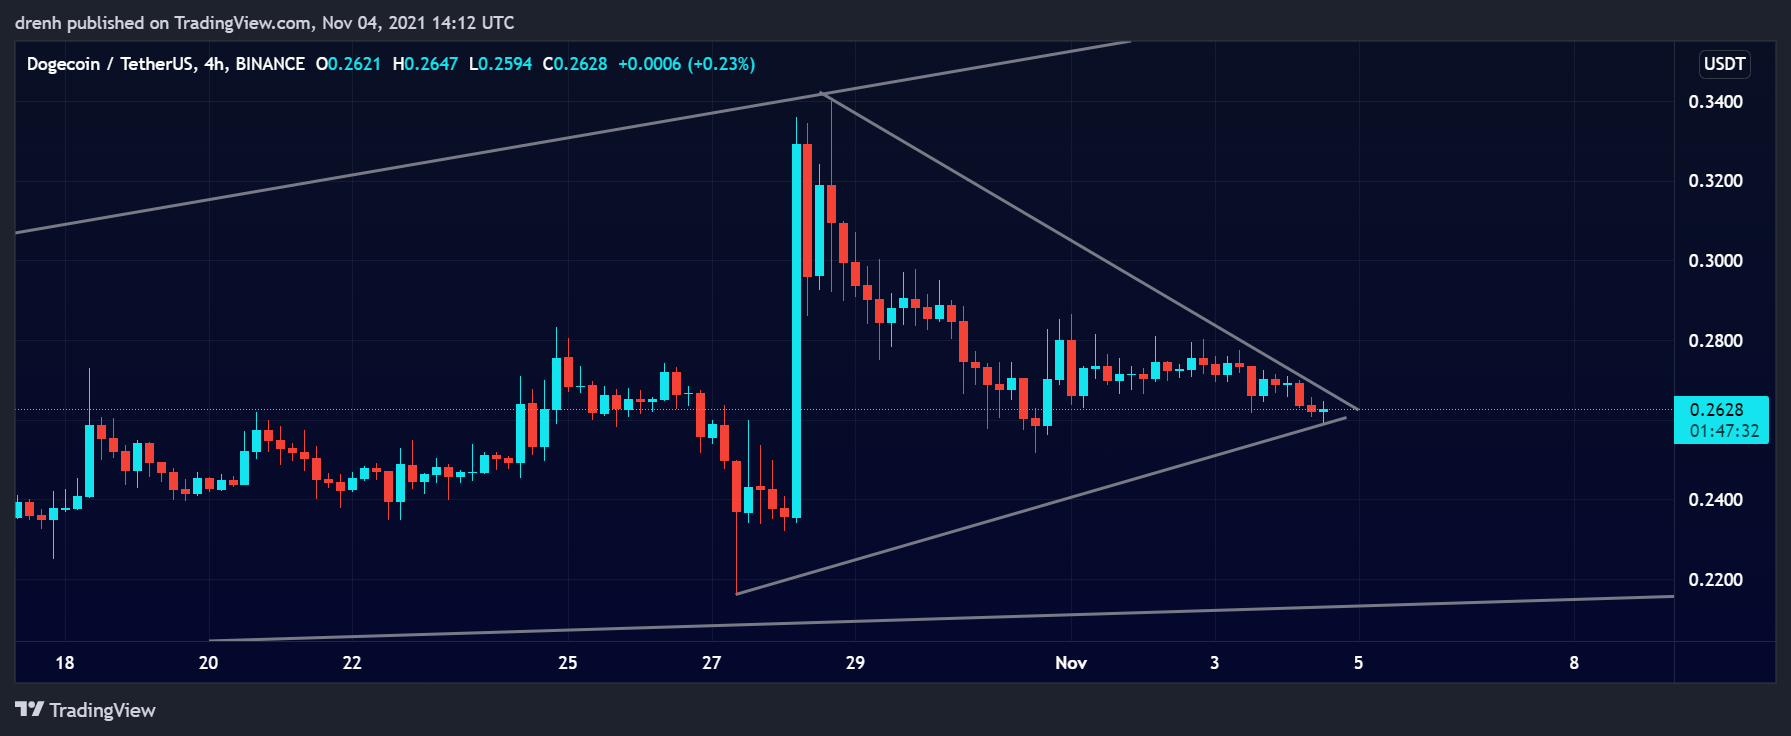
Weekly Analysis
In the last 7 days, the price of DOGE had a bullish breakout of 44%. However, the price has declined by around 25% after that. Since it has not gone below the initial price of the breakout, DOGE could still increase in the coming days. Furthermore, a triangle pattern has taken shape, indicating that another breakout might occur soon.

Daily Analysis
In the intraday chart, DOGE has been highly volatile, and its price has declined by around 4% so far, indicating that the shorter-term trend is bearish for DOGE and that the price may soon retest support.
Key Structures
Support
- $0.25
Resistance
- $0.34
Indicators
Moving Average
The 20-day moving average is currently slightly below the current price of DOGE, meaning that the trend is still upward and that the price could keep increasing in the coming days if it finds support soon.
The 9-day EMA has now moved above the price due to the recent dip in the price, indicating that the trend is now downward in the shorter term and that the EMA line could act as resistance to upward movement.
Relative Strength Index
The RSI of a daily chart is fairly average and has slightly declined recently, indicating that the price has room for both increasing or decreasing.
MACD
The MACD line has now intersected with the signal line after being above the latter. This indicates that the momentum is shifting and that the price of DOGE could decline as the selling pressure increases.
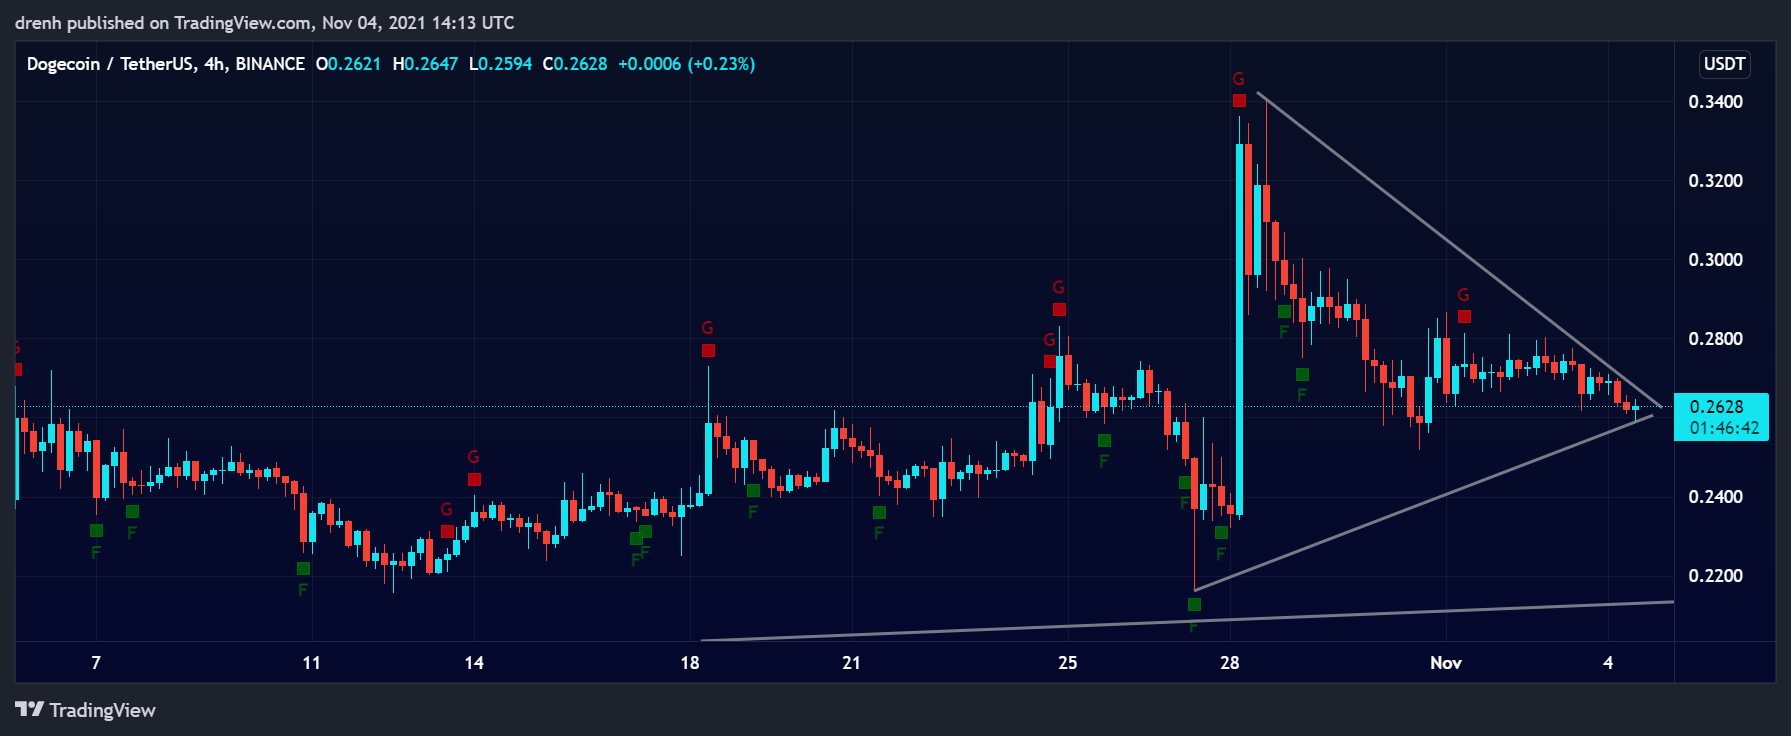
Fear & Greed
The fear and greed indicator of a 4-hour chart suggests that the emotion of DOGE traders was recently greed, but it is now slowly transitioning to fear due to the recent price decline.
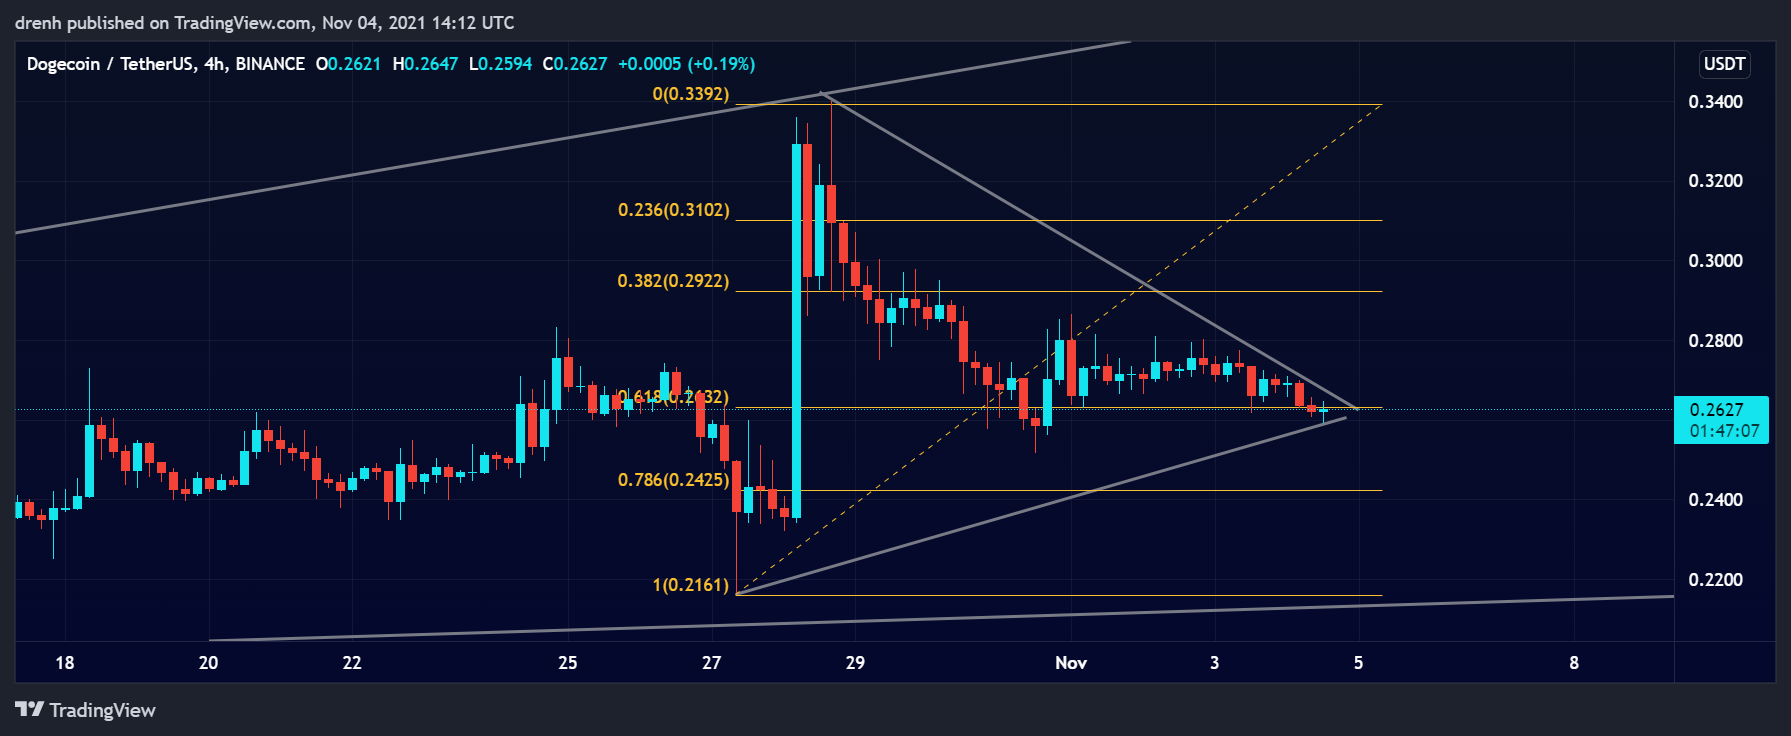
Fibonacci
The Fibonacci retracement levels of a 4-hour chart suggest that the price of DOGE is retracing ad has penetrated the 61.8% level. If the price further declines, we could see DOGE find support at the 78.6% region.
Price Prediction DOGE – November 2021
Based on this technical analysis on Dogecoin (DOGE), we could see its price increase in the coming days if it finds support at the projected structures. Furthermore, judging by the recent price movement, a breakout might occur soon, which could see DOGE break resistance and aim even higher. If BTC keeps increasing and the hype for meme-influenced coins remains high, we could see DOGE increase up to its all-time high. A price of $1 is possible in the longer run.
Latest News for DOGE – Affecting Price
Recently, Dogecoin and Shiba Inu have become the most traded cryptocurrencies in the Indian crypto marketplace. This indicates their global influence and how the hype around them may keep going in the coming months.
Also read: Dogecoin Price Prediction 2022 – What Will the Dogecoin Price be in 2022 and in Next Years to Come?