


ADA Technical Analysis – November 2021
Monthly Analysis
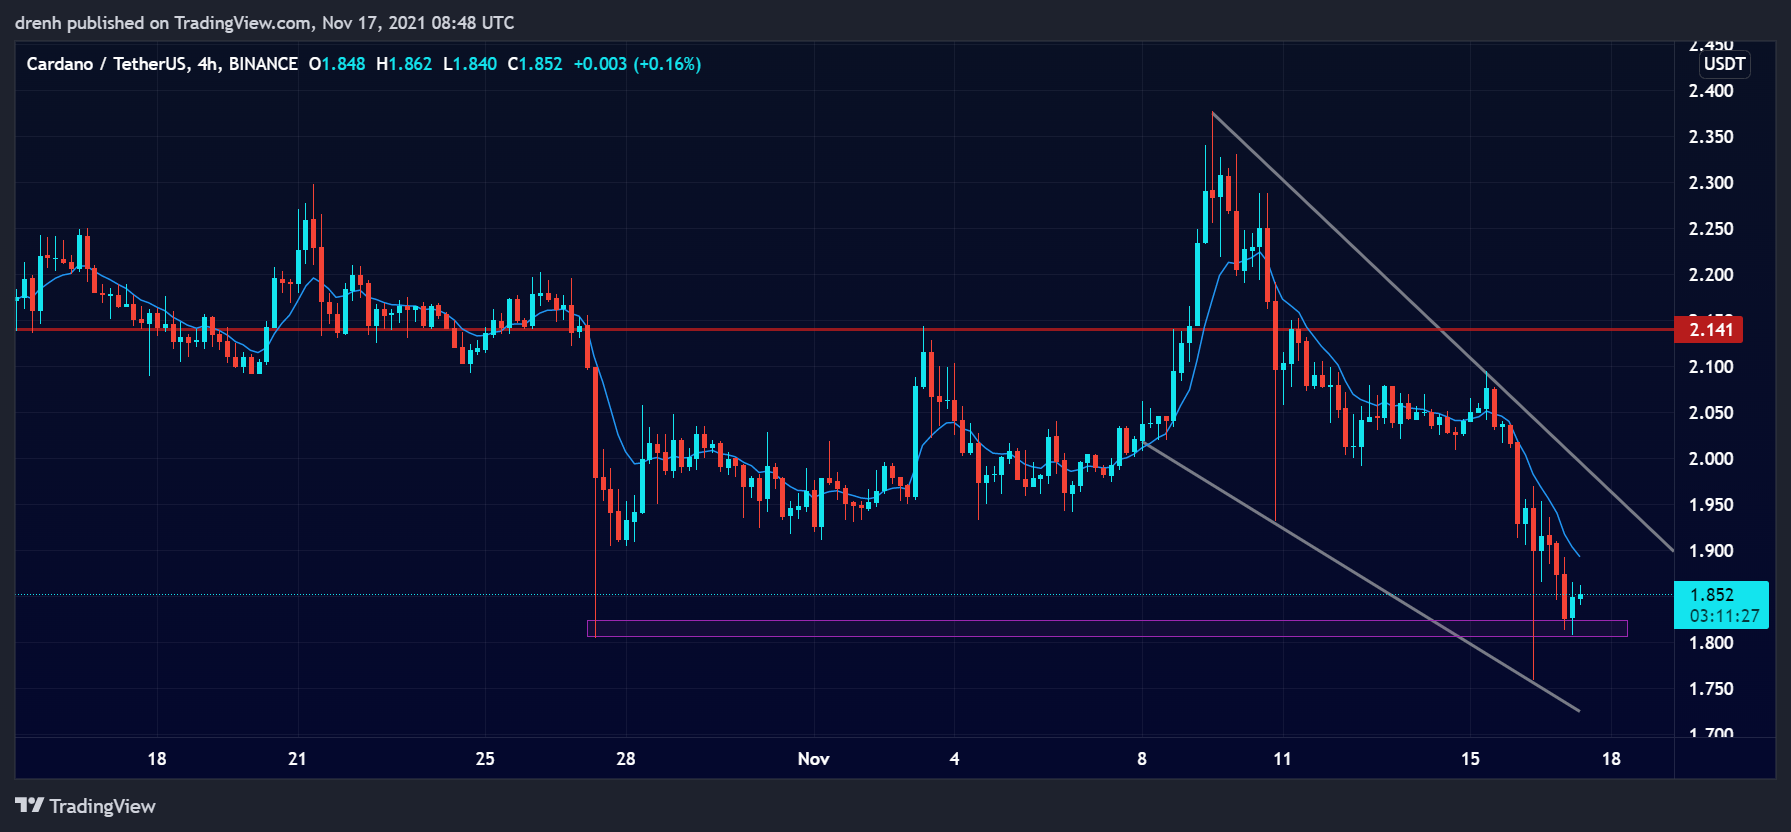
In the last 30 days, the price of ADA initially declined by 21%. After that, the price rebounded upwards, and a rounding bottom pattern made the price increase by 31%, indicating that ADA reversed the trend. However, after ADA hit resistance at $2.37, the price of ADA declined by 26%. Currently, ADA is in a downtrend in a 4-hour chart, and its price may have an impulse soon.

Weekly Analysis
In the last 7 days, ADA has been bearish. The price has declined by 18%. This indicates that ADA may now go further down n a 4-hour chart. The price has recently found support at $1.80, meaning that the price can have an upward impulse in the short run.
Daily Analysis
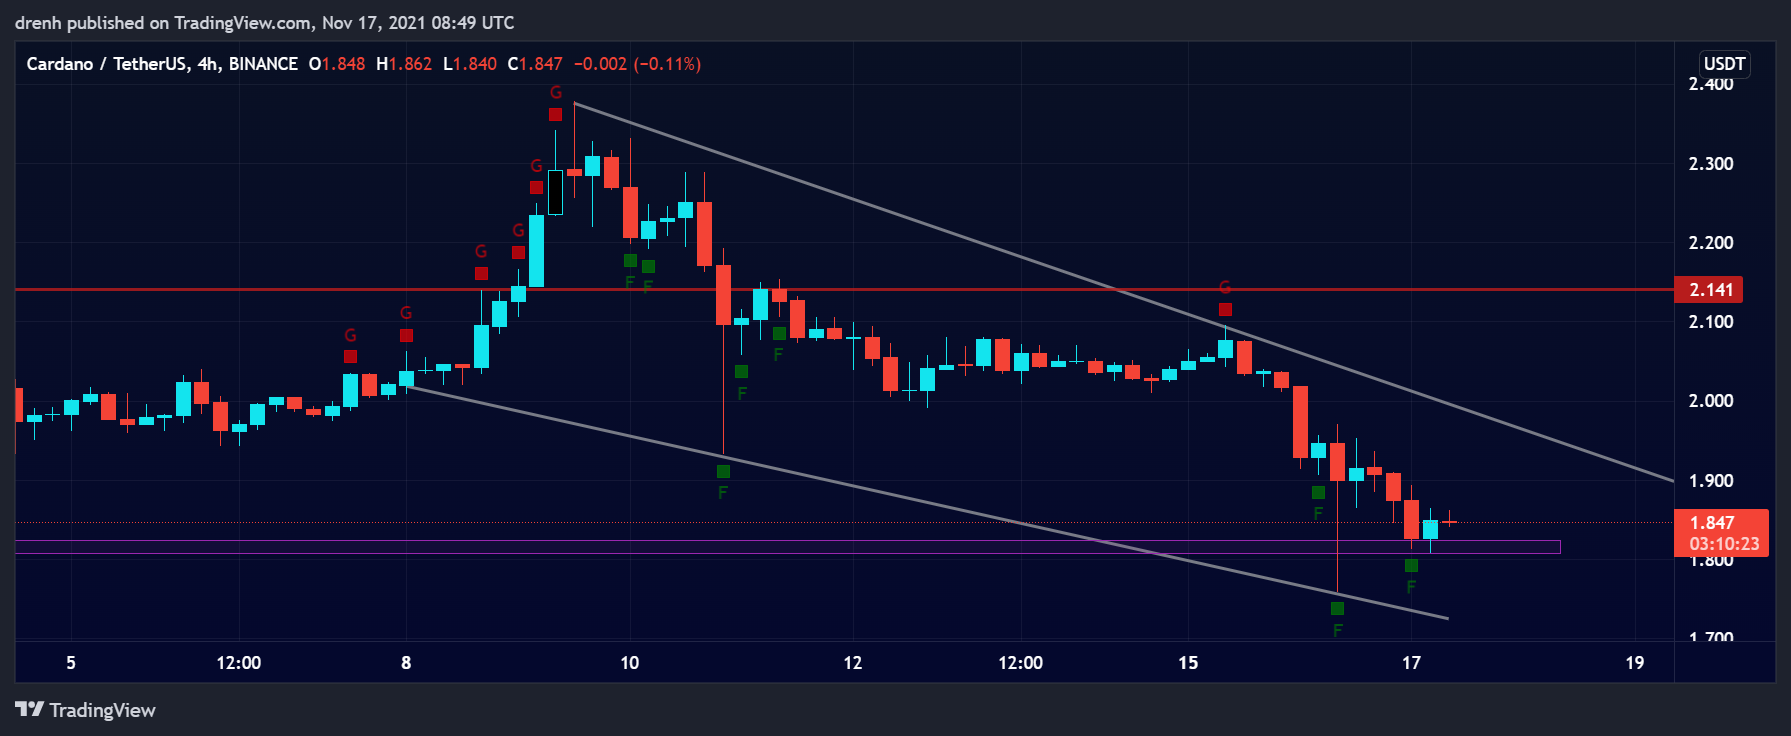
In the intraday chart, ADA has been highly volatile. After increasing by 10% in the last 24 hours, the price started declining again. It has declined by 7% so far and it may keep decreasing even further.
Key Structures
Support
- $1.75
Resistance
- $2.10
Indicators
Moving Average
The 20-moving average is above the price due to the recent downtrend. This indicates that the price of ADA can go further down in the coming days of this month.
The 9-EMA is also above the price due to the recent bearish run. The EMA line can act as resistance if the price of ADA attempts to increase in the short run.
Relative Strength Index
The RSI of a 4-hour chart is currently below 30, meaning the ADA is being oversold. This indicates that the price may have a bullish impulse until the RSI is back on the 30-70 region once again. This also indicates that there is plenty of room for growth for the price of ADA.
MACD
The MACD line of a 4-hour chart is below the signal line. This indicates that the momentum is bearish for ADA and that the price could keep declining in the short run. The lines are not showing any signs of converging as of now.
Fear & Greed
The fear and greed indicator of a 4-hour chart suggests that the current emotion of ADA traders is fear due to the recent downward trend of the price.

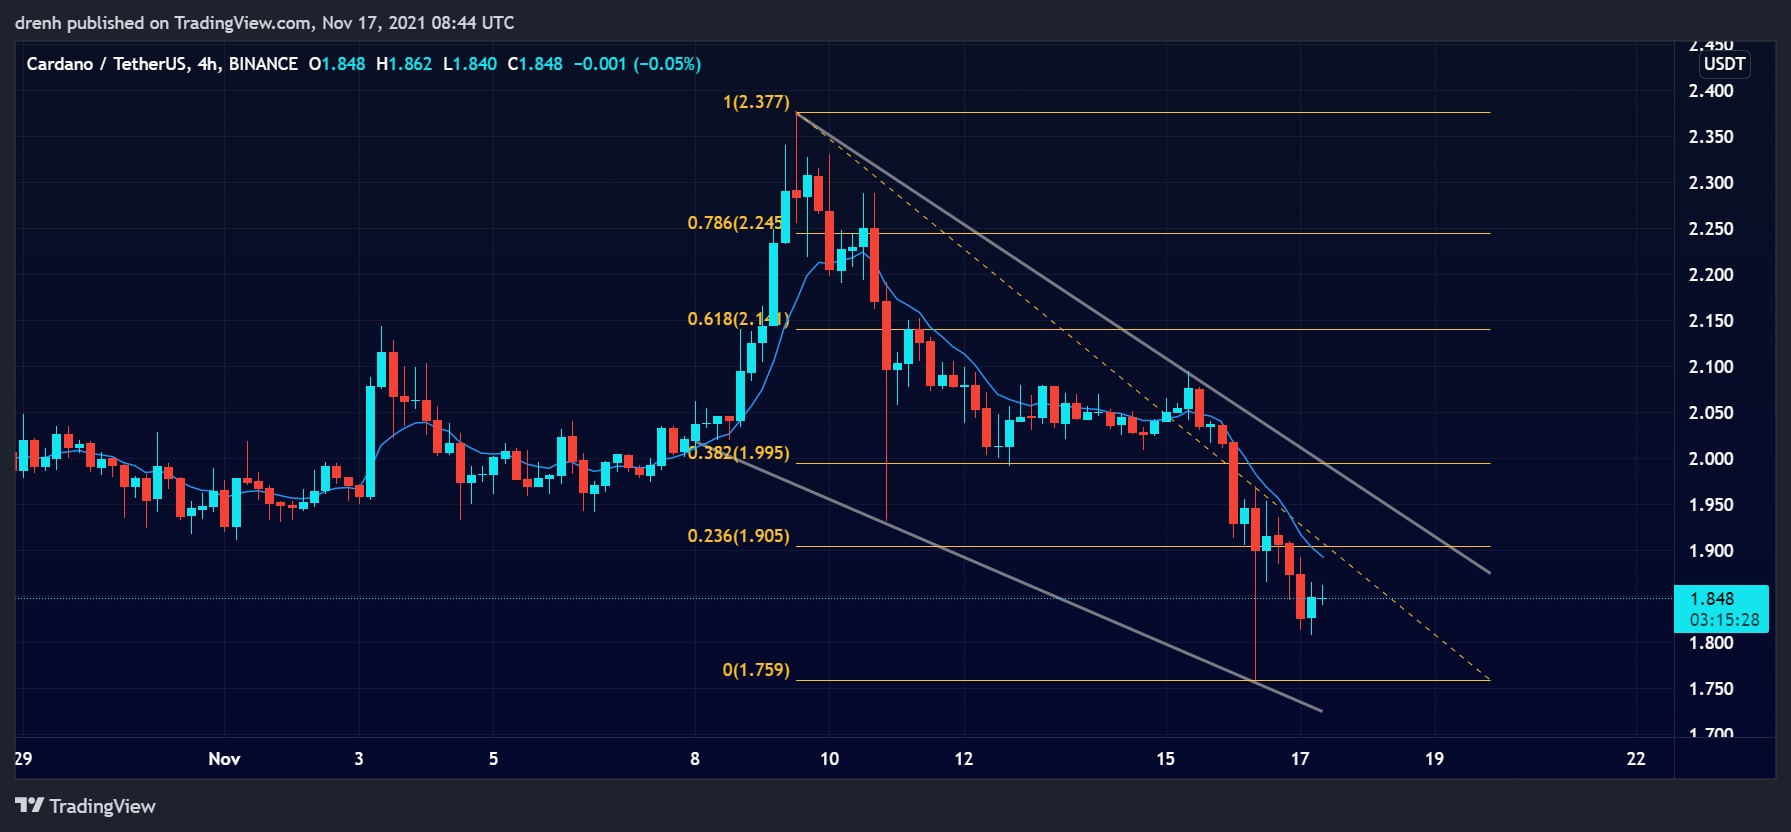
Fibonacci
The Fibonacci retracement levels suggest that the price of ADA can have an upward impulse and face resistance at one of the Fibonacci levels. The 38.2% may prove to be a strong resistance structure for ADA. If that occurs, then ADA may continue this downtrend.
Price Prediction ADA – November 2021
Based on this technical analysis of Cardano (ADA), we could see its price have a correction in the short run before continuing to go further down, The price of ADA may go as low as $1.60 in the coming days. However, if the buying pressure increases, ADA has the potential to go as high as $3.5 by the beginning of 2022, and as high as $5 in the long run, especially if BTC keeps its bullish nature and institutional money keeps flowing in the market.
Latest News for ADA – Affecting Price
Cardano has recently partnered with Odin, which is a promising project that looks to make the trading experience more accessible, easier, as well as allow users to monetize their created content. Cardano CEO has also recently suggested how big the Metaverse is for cryptocurrencies and vice versa, indicating that the Metaverse can have a huge effect on Cardano.