

ZIL Technical Analysis – October 2021
Monthly Analysis
Over the last 30 days, ZIL has increased by more than 50%. After increasing and hitting resistance at $0.107 twice, the price retraced by around 20%. Nonetheless, ZIL gound support at $0.086 and then started increasing again. The trend is facing upward, indicating that ZIL is bullish.
Weekly Analysis
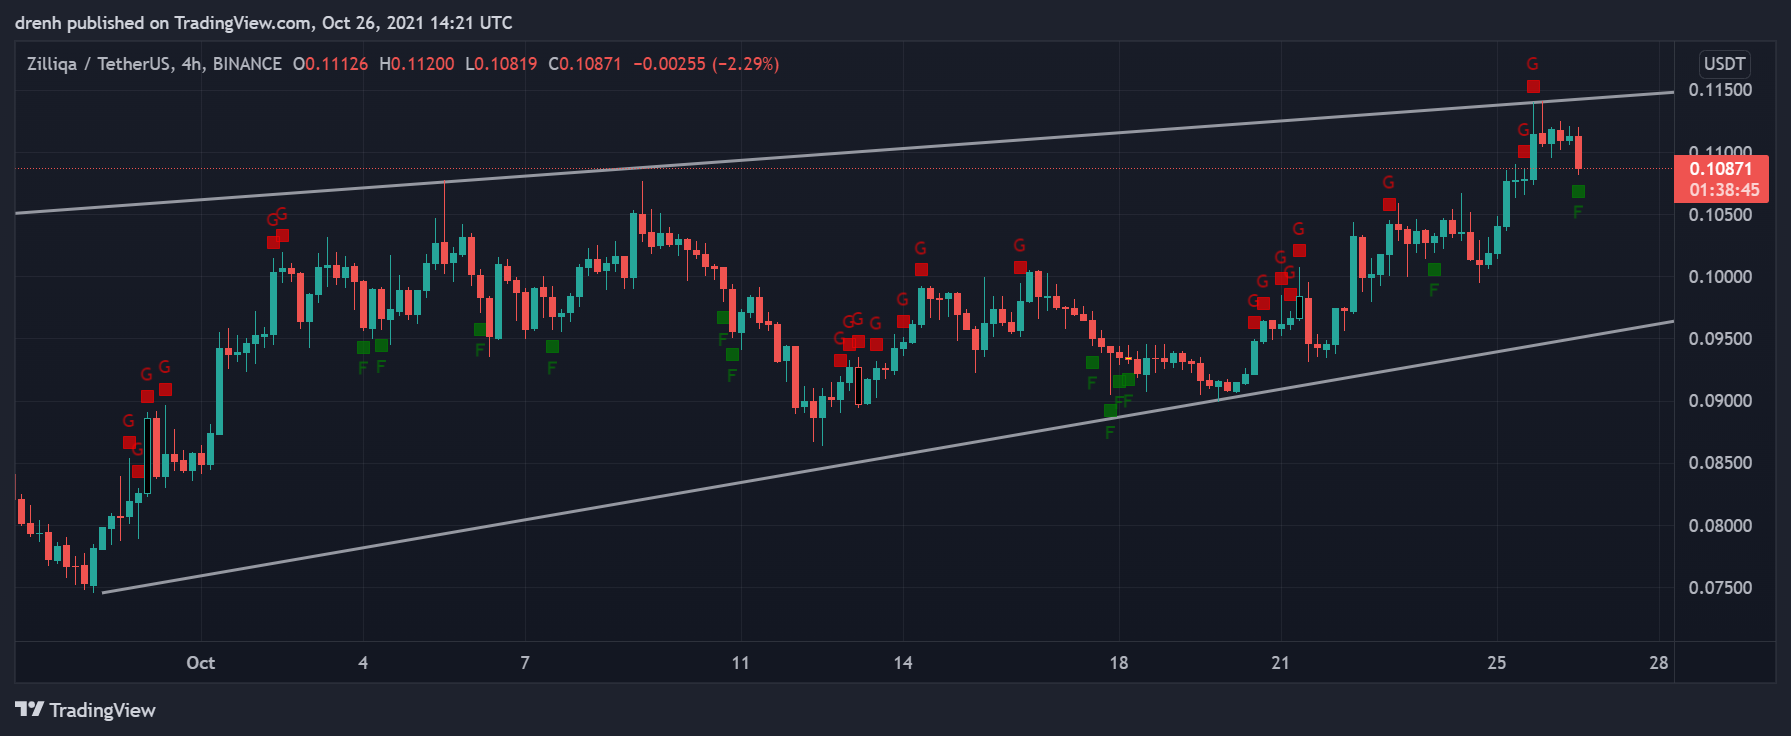
In the last 7 days, ZIL has been bullish. The price has increased by around 27%, but it has failed to beat resistance at $0.11. The price could retrace in a 4-hour chart, but it may eventually keep increasing after that.

Daily Analysis
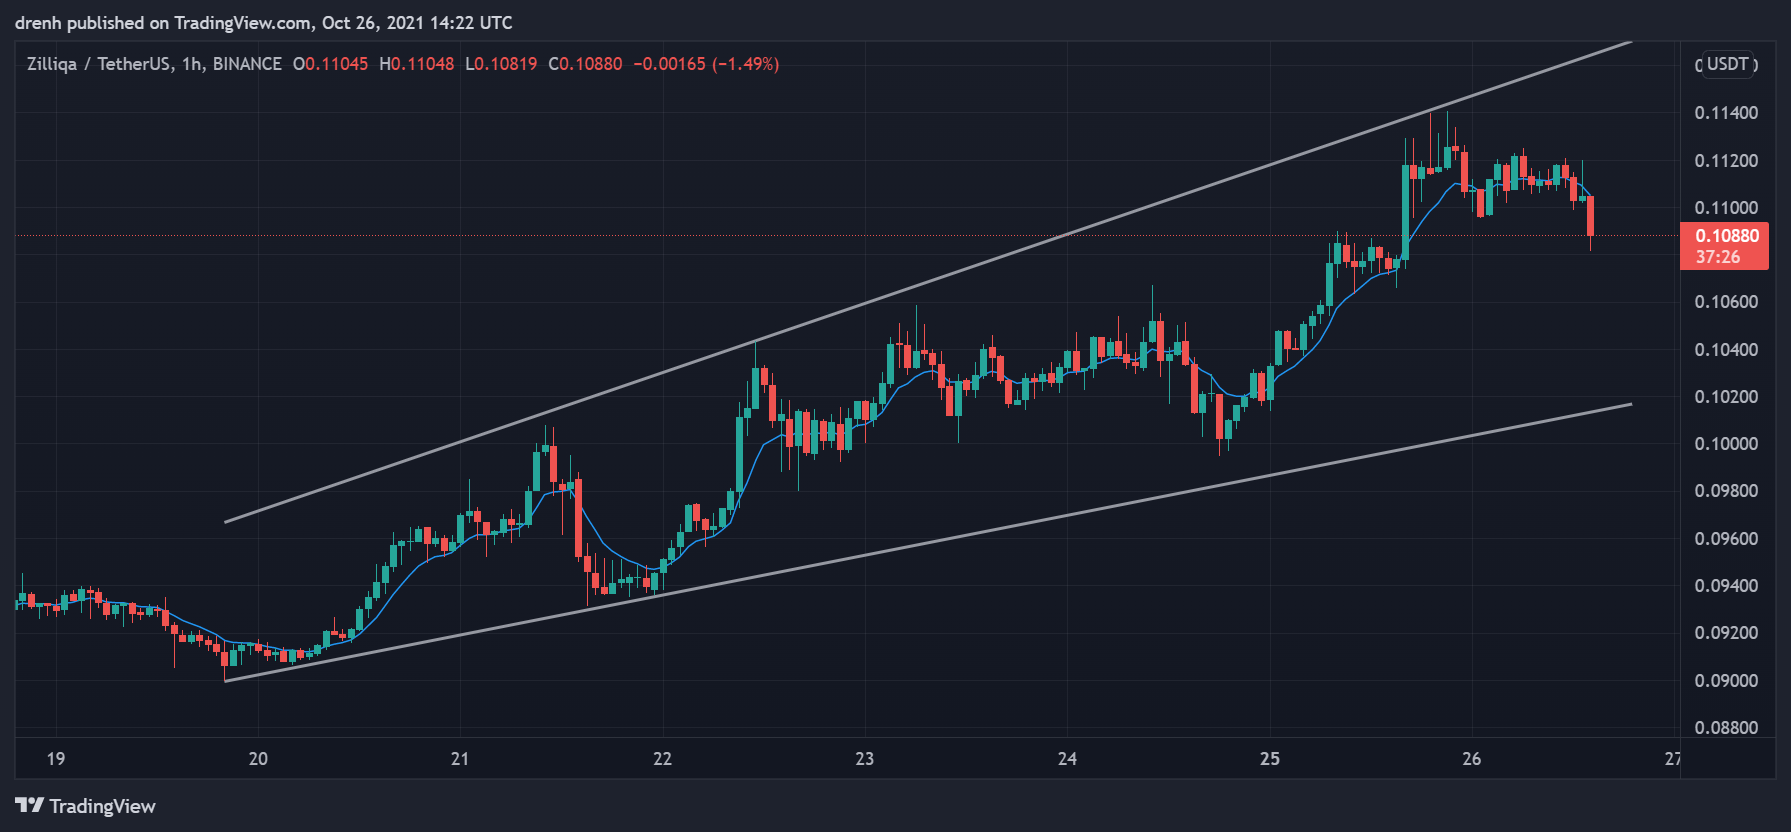
In the intraday chart, the price of ZIL was in consolidation, but with high volatility. In the last few hours, the price has declined by more than 3%. The price of ZIL could keep decreasing in the intraday chart.
Key Structures
Support
- $0.099
Resistance
- $0.11
Indicators
Moving Average
The 20-day moving average is below the price, indicating that the trend of ZIL is upward and that its price can keep increasing in the coming days.
The 9-day EMA is also below the price and hints at price increases. The EMA line is currently acting as support to the price of ZIL
Relative Strength Index
The RSI is bullish and somewhat close to 70. It has slightly declined in the last few hours. In a 4-hour chart, the RSI is even more bullish and it recently was in the overbought region.
MACD
In a 1-day chart, the MACD line is above the signal line and above the baseline, indicating that the momentum is bullish and that the price of ZIL can increase in the short run. In a 4-hour chart, these lines are slowly converging, suggesting that the momentum might shift soon.
Fear & Greed
The fear and greed indicator of a 4-hour chart suggests that the current emotion of ZIL traders is fear due to the recent pullback.

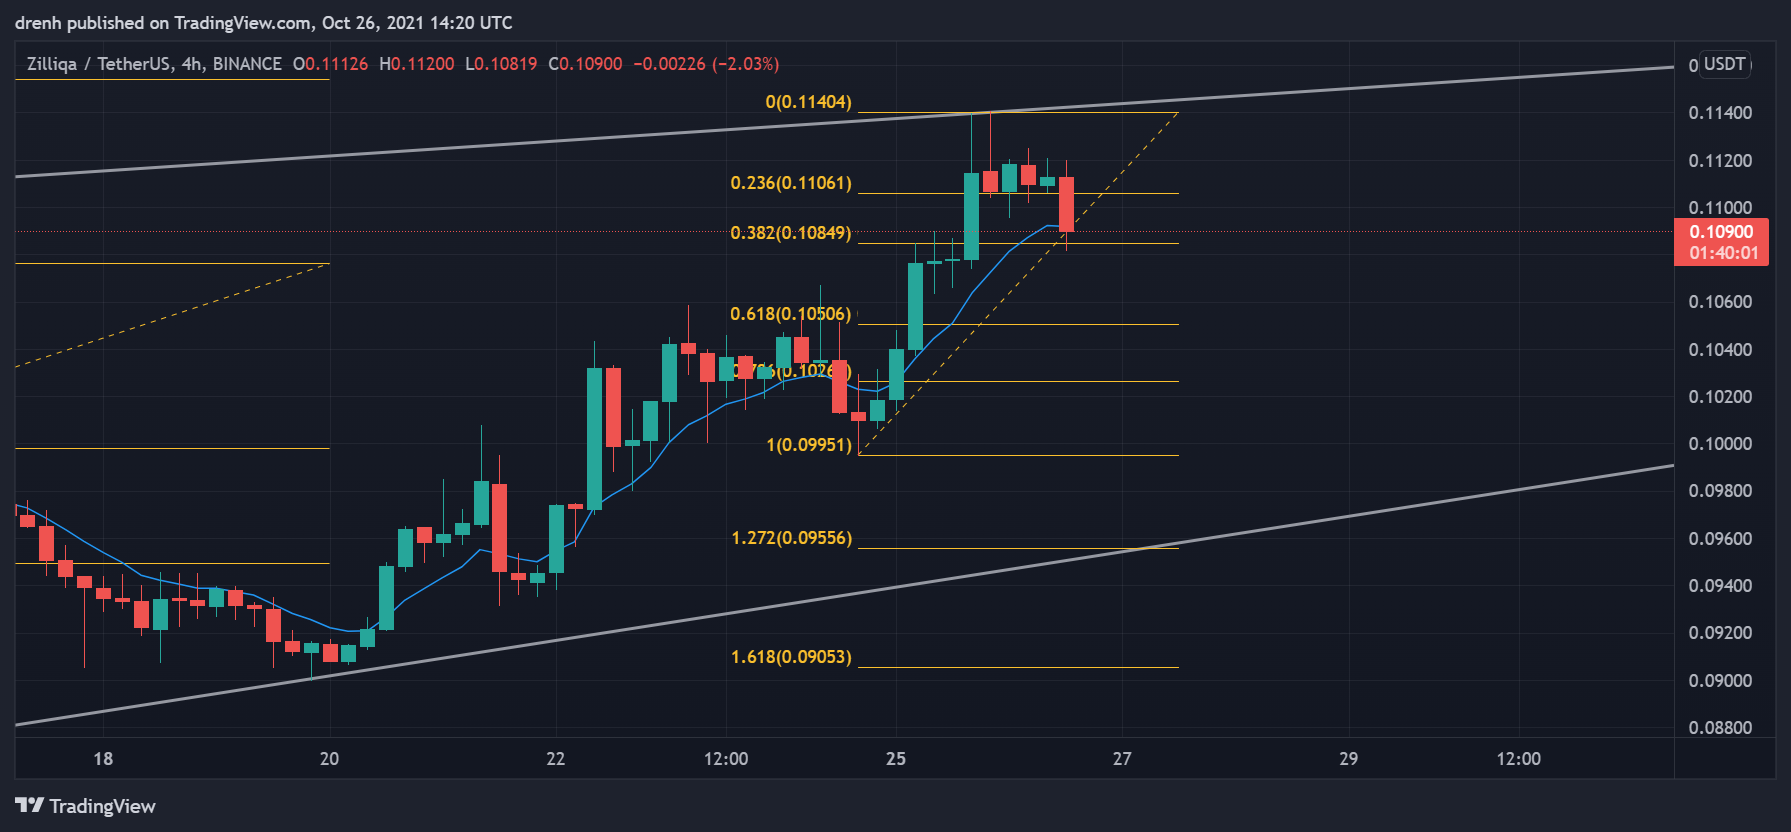
Fibonacci
The Fibonacci retracement levels suggest that ZIL might eventually find support at one of the levels. The 61.8% might be a strong support zone, and if the buying pressure is high enough, the price of ZIL could move to one of the extension levels.
Price Prediction ZIL – October 2021
Based on this technical analysis on Zilliqa (ZIL), its price could retrace in the coming hours, but it may keep increasing as the market is bullish and the channel is ascending. If it breaks resistance, ZIL could potentially go close to $0.20 in the coming weeks, other things equal. If BTC keeps its momentum and more institutional money is invested in cryptos, ZIL can even go as high as $0.50 by the end of the bull cycle.
Latest News for ZIL – Affecting Price
Ben Livshits, former Chief Scientist of Brave has joined the Zilliqa team as CEO. With his expertise and credentials, Zilliqa can improve and grow its community, which can have positive effects on the price of ZIL.
Also read: Zilliqa Price Prediction 2021 and Beyond – Is ZIL a Good Investment?