


UNI Technical Analysis – August 2021
Daily Analysis
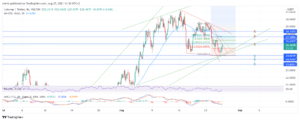
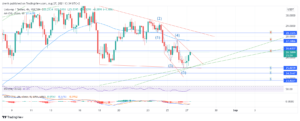
Uniswap was on the rise until it started to decline again at large rates. The trend has reversed and is now heading downwards. Structure levels are going to be key in determining the future outcome of the price of UNI. If resistance is broken, then an uptrend can begin.
Intraday Thoughts
Recent price changes of UNI have made a lot of investors uncertain since it is becoming increasingly difficult to determine how the price might move. Recent intraday price increases might prove to be corrections if selling pressure is high at resistance.

Key Structures for Uniswap
Support
- $25, $24.5, $23.8
Resistance
- $26.6, $27.6, $28.3
Indicators
Moving Average
The 20-day moving average has recently moved above the candlesticks, indicating that the downtrend has started and UNI is now bearish. This moving average can now act as resistance for UNI.
As for the 50-day moving average, it is still below the candlesticks, and it may act as a level of support in the longer term.
Relative Strength Index
The Relative Strength Index is fairly average and is neither close to 70 nor 30. This indicates that UNI has room to both increase or decrease. Since UNI is already in a downtrend, perhaps this might mean that the RSI is going to decrease in the next few days.
MACD
Understandably since the trend was reversed, the MACD is below the signal line, indicating a shift in momentum. If this continues, MACD is heading below the baseline really soon.
Fibonacci
Fibonacci retracement levels can act as solid levels of resistance for UNI. The 38.2% level is at $26.6 and is also at the same area as the descending channel of UNI. This zone is going to be crucial for UNI’s price in the coming days. If this zone is broken, then the 61.8% can also be a good level of resistance since it aligns with the previous high.
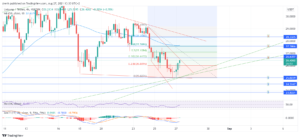

Head And Shoulders
We might also be looking at a potential inverted head-and-shoulders pattern. With the first shoulder and the head already forming, the neckline can act as resistance. This also entails that UNI can break the first resistance level at 38.2%.
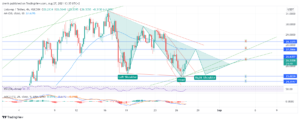

Double Top
A pattern worth mentioning is the recent double top movement of Uniswap. Since the candlesticks in the second top did not close above the area of resistance, UNI reversed and started going down. This clearly depicts that UNI is now in a downtrend and can keep decreasing unless it finds strong support.
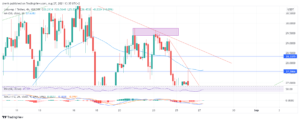

Elliot Waves
In the recent downtrend, we can also notice Elliot waves shaping up for Uniswap. The fifth wave might have finished, and now we can look for corrective A, B, and C waves that can reverse the trend.

Price Prediction Uniswap – August 2021
If the first resistance level projected in this analysis is strong enough to contain UNI, then UNI is going further down. In the coming days, UNI might go below $25. However, if the first resistance level is broken, then the trend is going to be reversed, and the Corrective A, B, and C Elliot waves can move UNI upwards to at least $27.5. Moreover, if the first support level has enough buying pressure, then a double bottom might be formed, where UNI can soar upwards again.
Latest News for Uniswap – Affecting Price
A recent proposal entailing $25 million worth of funding for analytical service provider Flipside Crypto has sparked conflict within the Uniswap community, especially for the former’s competitors, Dune Analytics. The latter argues that this funding is unfair and that Flipside Crypto may use at least half of the funds for their personal interest. Such conflicts may cause uncertainty for UNI traders.
If you want to learn more about Uniswap (UNI), check out this article:
Uniswap Price Prediction 2021 and Beyond – Is UNI a Good Investment?