
TRX Technical Analysis – September 2021
Monthly Analysis
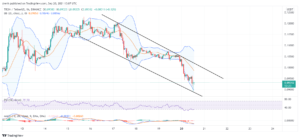
In the last 30 days, TRX increased by 50%. This increase was marked with a price of $0.123 on September 15th. However, the price started declining after that. TRX has declined by 28% ever since, and the trend is now downwards.
Weekly Analysis
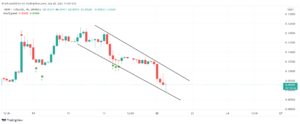
In the last 7 days, TRX has been declining, suggesting that the trend reversed. This decline might soon face support as TRX might attempt a pullback. Nonetheless, the short-term trend for TRX is bearish.
Daily Analysis
In the intraday chart, TRX recently found support at $0.088. In the coming hours, TRX might look to test resistance, but the trend is still facing downward and the price might go further down, other things equal.
Key Structures
Support
- $0.087
Resistance
- $0.1
Indicators
Moving Average
The 20-day moving average has just got above the price. This might suggest that the longer-term trend has also reversed and that the MA line might resist potential price corrections.
The 9-day EMA is also above the price and acting as resistance. In the coming days of this week, TRX might be looking at testing support at $0.087.
Relative Strength Index
The RSI of a daily chart is now below 50. While this suggests that the momentum is now bearish for TRX, it also means that TRON has room for surging upwards again. Key structures might be the key to determine the outcome of TRON’s price for the coming days.
MACD
The MACD line has just moved below the signal line, and it is now aiming to go below the baseline. This indicates bearish tendencies and that sellers might push the price of TRX further down.
Fear & Greed
Fear and greed indicator suggests that the current daily emotion for TRON is somewhat neutral, despite fear dominating when the downtrend started. It is unlikely that greed takes over any time soon.
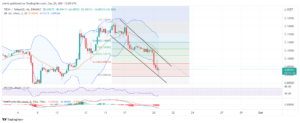
Fibonacci
The Fibonacci retracement levels of the recent downtrend suggest that the price of TRX could potentially retrace to the 38.2% level in the short run if TRX finds support at $0.087. If such a scenario were to occur, then TRX might edge closer to $0.08.
Price Prediction TRX – September 2021
Based on this technical analysis, we might see TRON go further down in the coming days since the trend is descending. Support might be key for a potential pullback up to the upper trend line, but indicators do not suggest that the buyers can take over again any time soon. If resistance at $0.1 is penetrated, then TRX might as well reverse and aim higher.
Latest News for TRX – Affecting Price
TRON remains one of the best ecosystems for the NFT market. The rise in popularity of the latter can greatly impact the price of TRX in the coming months, despite what technical analysis suggests. Palmar Labs recently started a new NFT project named TRON Cool Cats. Similar to Ethereum Cool Cats, this project can boost the demand for TRX even more.
Also read: TRON Price Prediction 2021 and for the Next 5 Years – Will TRX Reach $1?