


TRX Technical Analysis – October 2021
Monthly Analysis
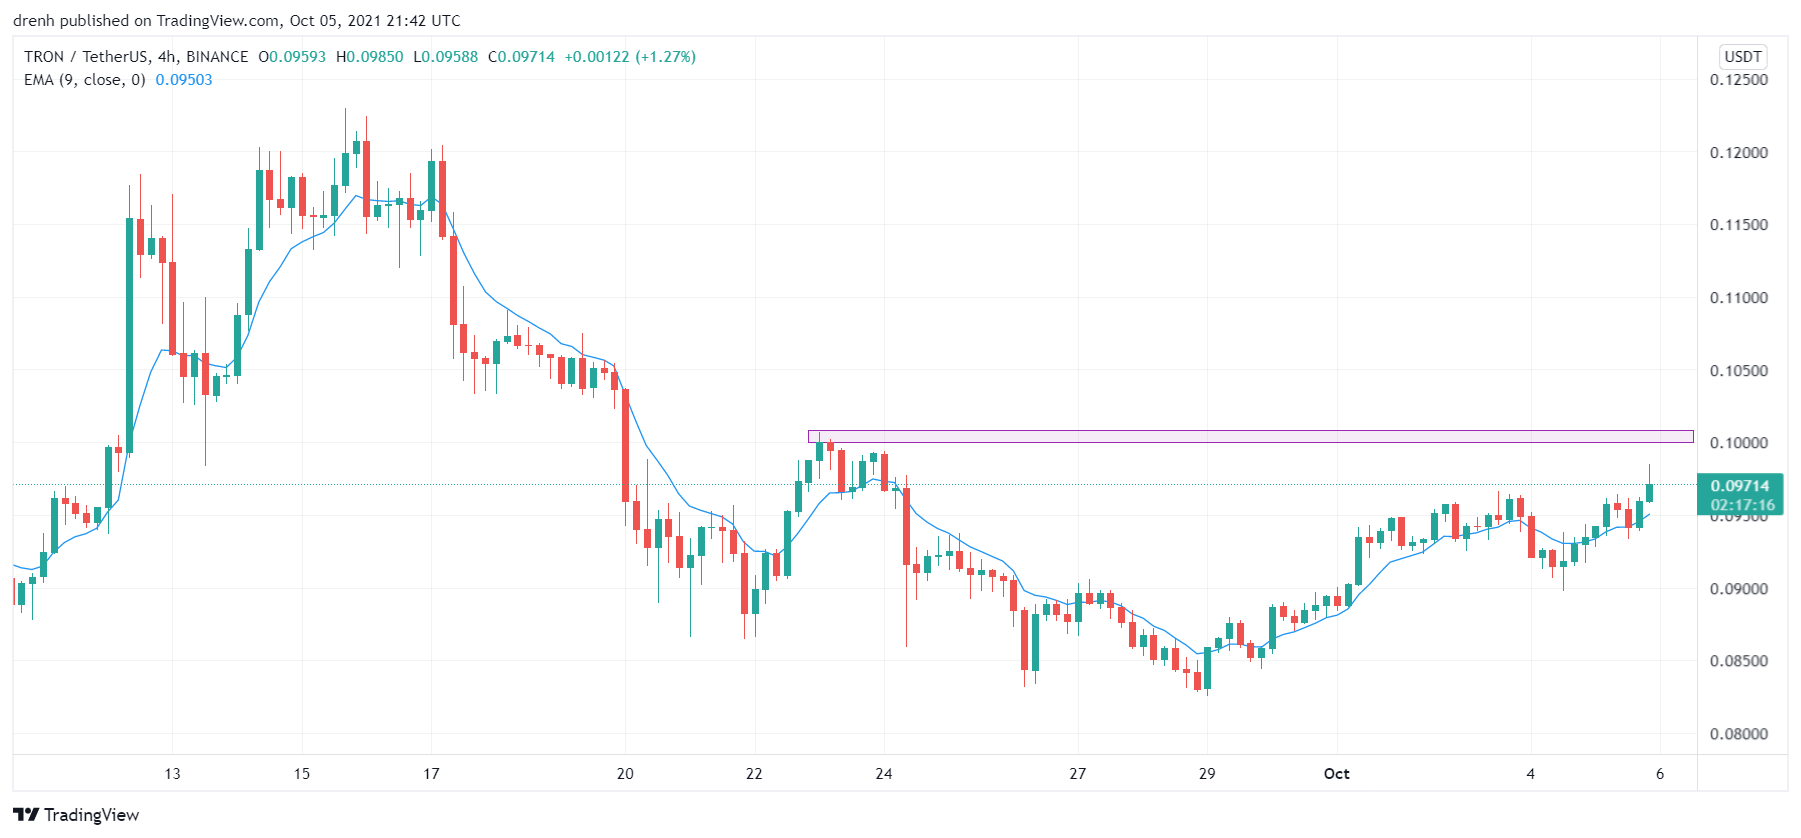
In the last 30 days, TRX initially increased by around 60%. This increase was then followed by a decrease of 32% in a span of two weeks. After that, the price of TRX has been constantly increasing and is looking to retest resistance at $0.098.

Weekly Analysis
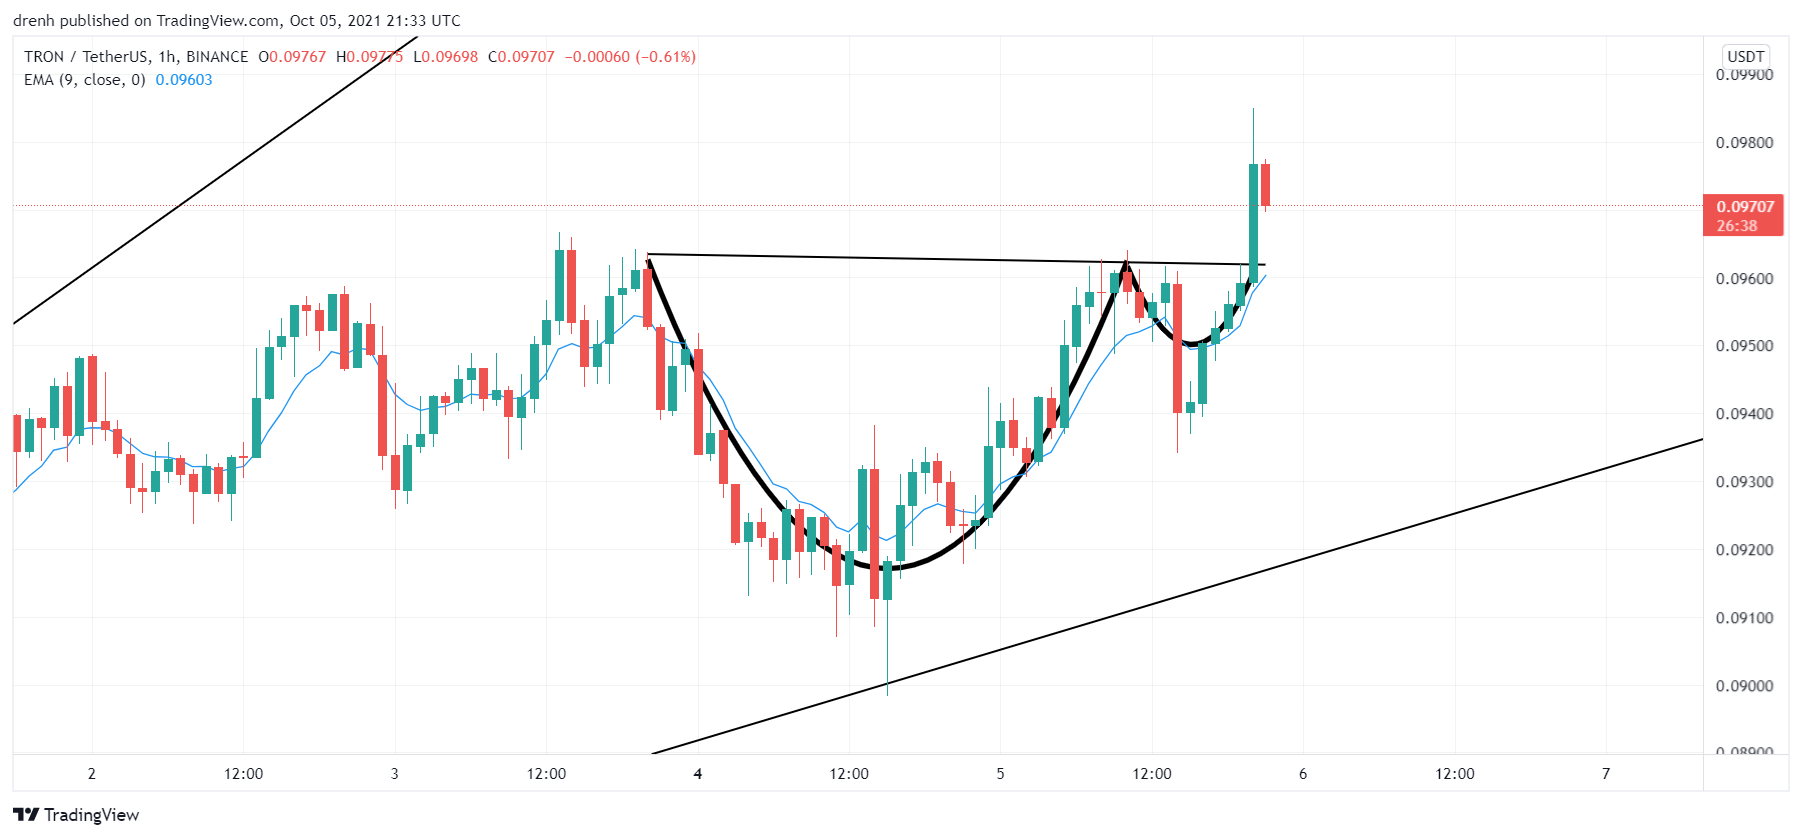
In the last 7 days, the price of TRX has increased by 19%. During these last few days, we can notice a cup-and-handle pattern. Such patterns indicate bullish tendencies. The pattern was respected as TRX had a bullish breakout.

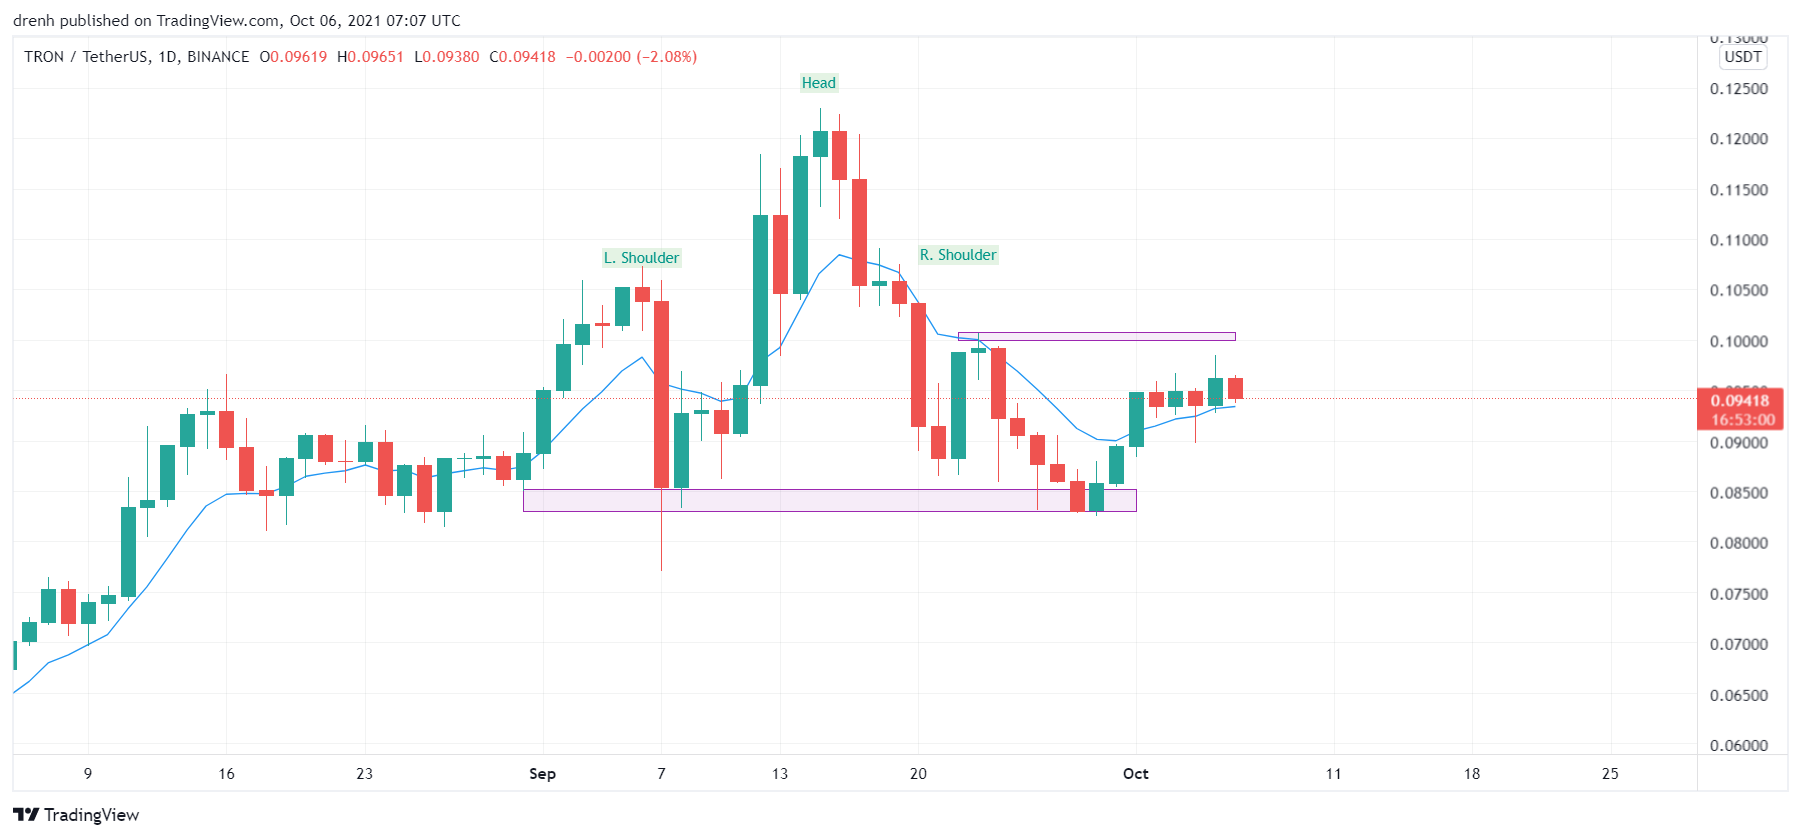
We can also notice a head-and-shoulders pattern in a daily chart. Since the neckline acted as support and was not broken, TRX kept its bullish tendencies.
Daily Analysis
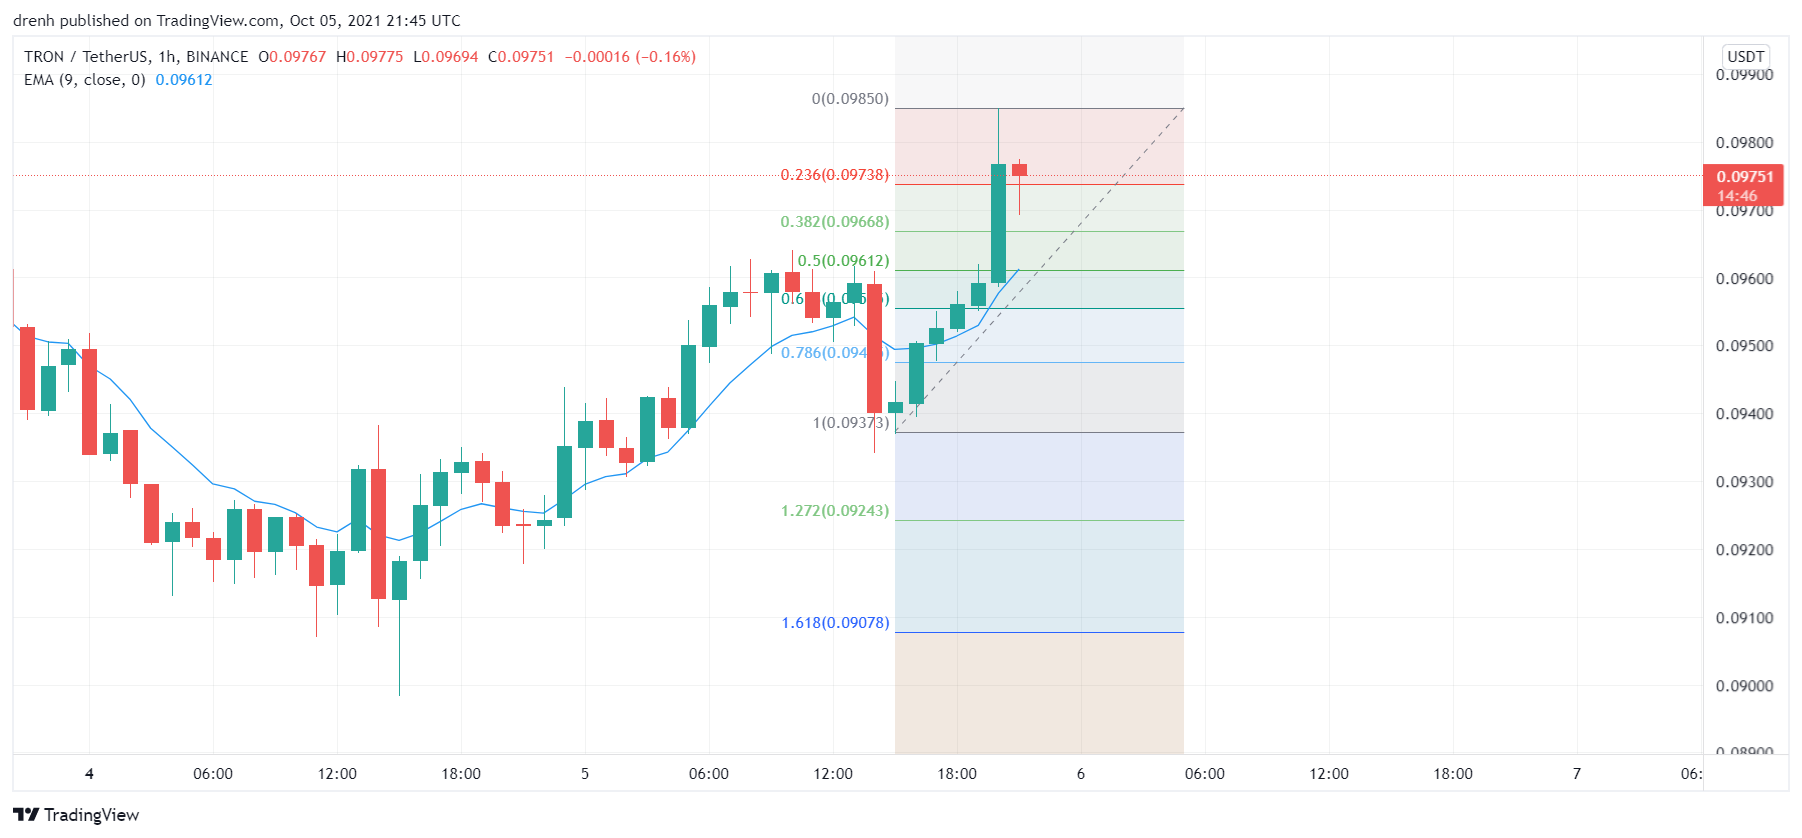
In the intraday chart, TRX has decreased by around 5%. In a 1-hour chart, TRX might look bearish, but the longer-term trend suggests that TRX can increase.
Key Structures
Support
- $0.09
Resistance
- $0.098
Indicators
Moving Average
The 20-day moving average has been above the price, indicating bearish tendencies. However, due to the recent price increase, the MA line has slightly moved below the price, indicating that the trend is now upward and that the MA line can act as support.
The 9-day EMA is also below the price and may act as support in the coming days.
Relative Strength Index
The RSI of a daily chart is fairly average at around 50. This indicates that the price of TRX can both increase or decrease in the coming days. In a 4-hour chart, the RSI is slightly more bullish for TRX.
MACD
In a daily chart, the MACD line has recently climbed above the signal line, indicating that the momentum is bow bullish while still being below the baseline. In a 4-hour chart, the MACD line and the signal line are very close to one another. Nonetheless, MACD is still above the baseline.
Fear & Greed
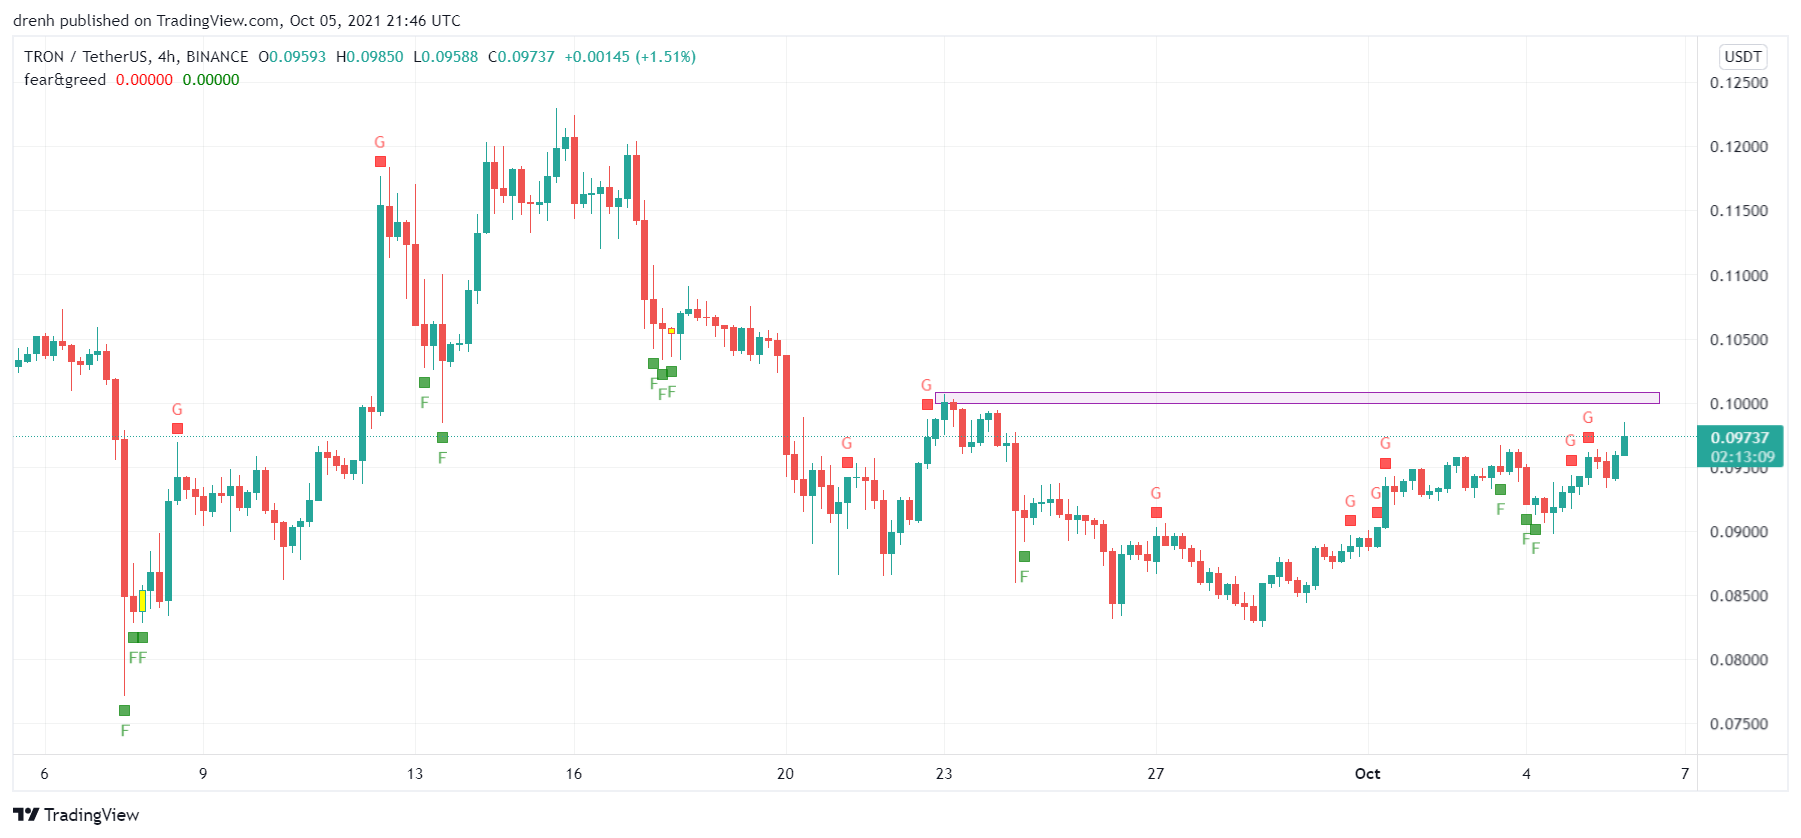
The fear and greed indicator suggests that the current emotion for TRX traders is greed, meaning that the price is bullish.
Fibonacci
The Fibonacci retracement level in a 1-hour chart suggests that the price of TRX could retrace to one of the levels. The price could even retrace to 0% and find support there.
Price Prediction TRX – October 2021
Based on this technical analysis of TRON (TRX), we could see its price increase in the coming days. If TRX finds support at the projected structures, its price could go close to $0.1.
Latest News for TRX – Affecting Price
APENFT has recently partnered with Cool Cats, a TRON-based NFT project that has been gaining attention recently. This can have a positive effect on the price of TRX, especially since NFTs are becoming one of the most important assets of 2021.
Also read: TRON Price Prediction 2021 and for the Next 5 Years – Will TRX Reach $1?