

TRON or Tronix is the indigenous mainnet crypto coin distributed by TRON decentralized organization DAO. Our TRON price analysis today will revolve around the inconsistent trend among buyers and sellers. Ranked over 130 exchanges, TRON claims to be one of the biggest blockchain-based operating system.
TRON’s price reached $0.07767 on the 3rd of January; however, it took a rapid plunge down to $0.05192 on the 24th of January 2022. TRON price then climbed back to $0.070 on the 10th of February 2022.
TRON took rapid leaps three times on the 31st of March 2022 ($0.07786), 5th of May 2022 ($0.08719), and 8th of May ($0.08931) before seeing the year-to-date (YTD) high of $0.09045 on the 1st of June 2022. The year-to-date (YTD) low was recorded at $0.05045 on the 15th of June 2022.
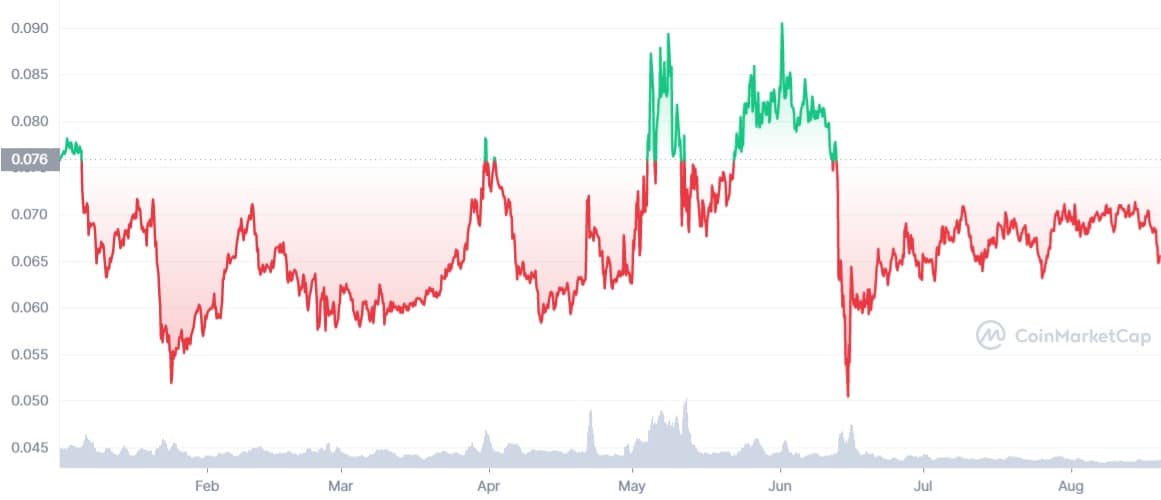

The trend has been turbulent for TRON price from the start of 2022. However, we’re beginning to see some stability ever since June fall.
TRON price analysis: TRX stabilizing after flash drop
Similar to other relatively new crypto coins, including Shiba Inu and Uniswap, TRON’s price has somewhat stabilized in August 2022. But the TRON TRX price never plunged above the $0.08 mark in the last two months. However, a head and shoulder movement that started building on the 15th of August has finally completed today and the price well rapidly down to the current price standind at $0.0648.
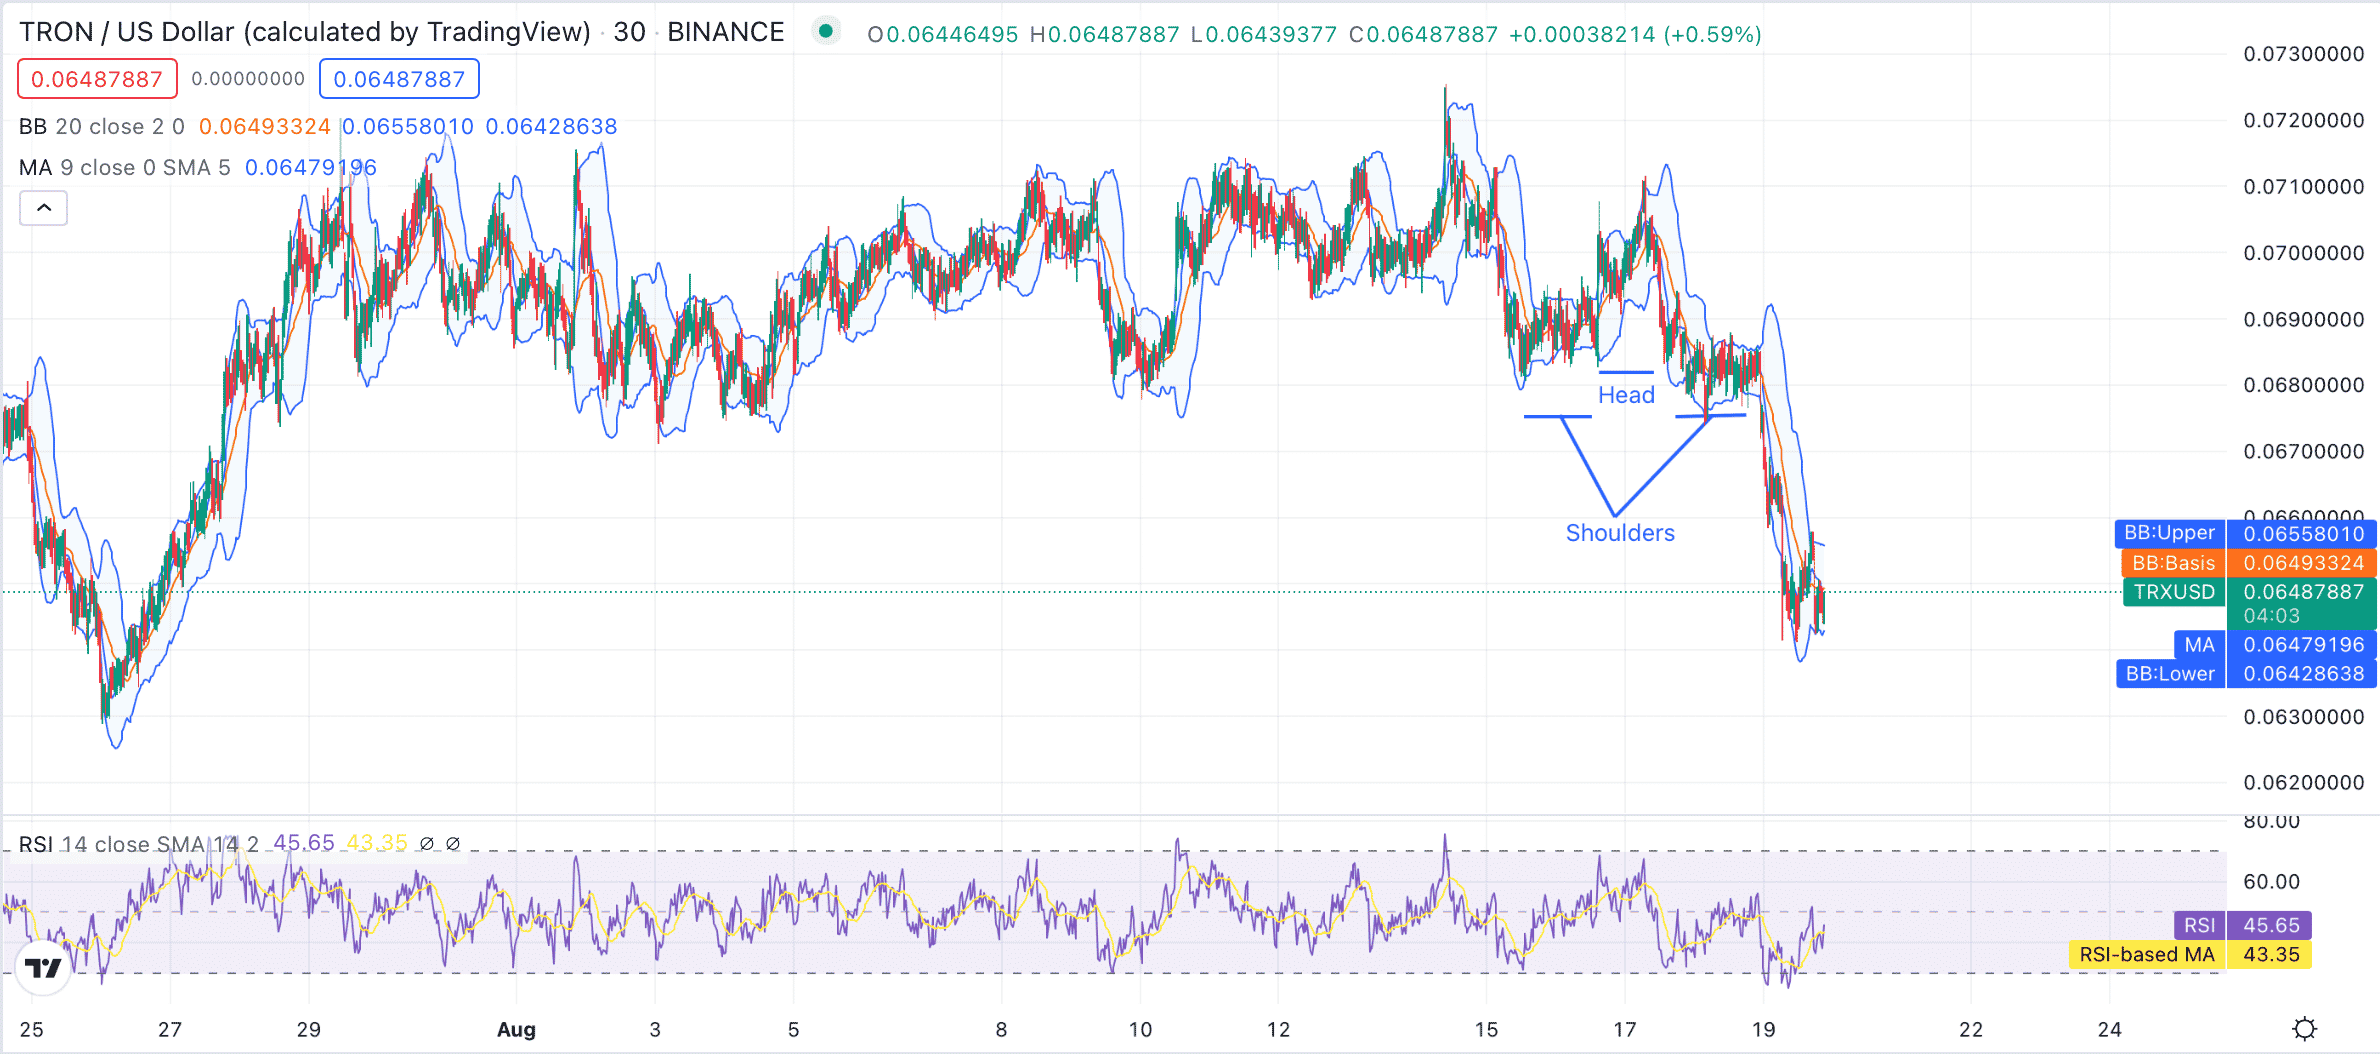

A very unsteady relative strength index (RSI) score is present at 45.65 points, hinting at an inclination towards overselling. Nevertheless, the current RSI keeps shifting very quickly. At present, the RSI moving average is 43.35.
Although the RSI shows a reverse head and shoulder forming at the time of the drop, the RSI patterns don’t convert into price movement patterns. However, a head and shoulder is often reversed and followed by the reverse head and shoulder pattern, that can lift the price back up.
TRON has managed to gain some support at the time of writing. TRON faces constant resistance from Bollinger Band (Upper), which stands at $0.0656 along with the $0.0649 Bollinger Band (Basis). The moving average keeps climbing up and down, providing both support and resistance rapidly.
It presently stands at the $0.06479 mark serving as a support point. Bollinger Band (Lower) attempts to increase the price by lending support at $0.0642.
TRON price has been bouncing up and down all August, and despite the bearish trend, it’s bound to climb back up in the coming days. The ongoing volatility seems risky, and at the moment, TRON needs massive support to rise again.
TRON is a 2nd tier cryptocurrency that traders turn to when the overall market is in sway owing to the lower per coin value. The gains made and the sheer complexity of the calculations alone keeps some of the traders away for good.
Although, at the time of writing, it appears that heavy sales were made between the 10th to 14th of August, and the sell-offs are now pushing the price to the strongest support levels found at the $0.0629 mark.
TakeAways
- TRON price faced a head and shoulder formation today.
- A flash drop was observed after the head and shoulder pattern.
- The coin seems to be a victim of heavy market attention between 10th and 15th of August.
- If current price support fails the price may drop to $0.062 level.
- If a reverse head and shoulder forms, the price can go up to the $0.08 high.
Disclaimer: The information provided on this page is most accurate to the best of our knowledge; however, subject to change due to various market factors. Crypto-Academy encourages our readers to learn more about market factors and risks involved before making investment decisions.