


TFUEL Technical Analysis – October 2021
Monthly Analysis
In the last 30 days, the price of TFUEL has declined by around 25%. TFUEL found support at $0.25 as the buying pressure was high, and it then started increasing. It increased by 29% and it reached as high as $0.32, where it encountered resistance due to the high selling pressure. The price started declining after that.
Weekly Analysis
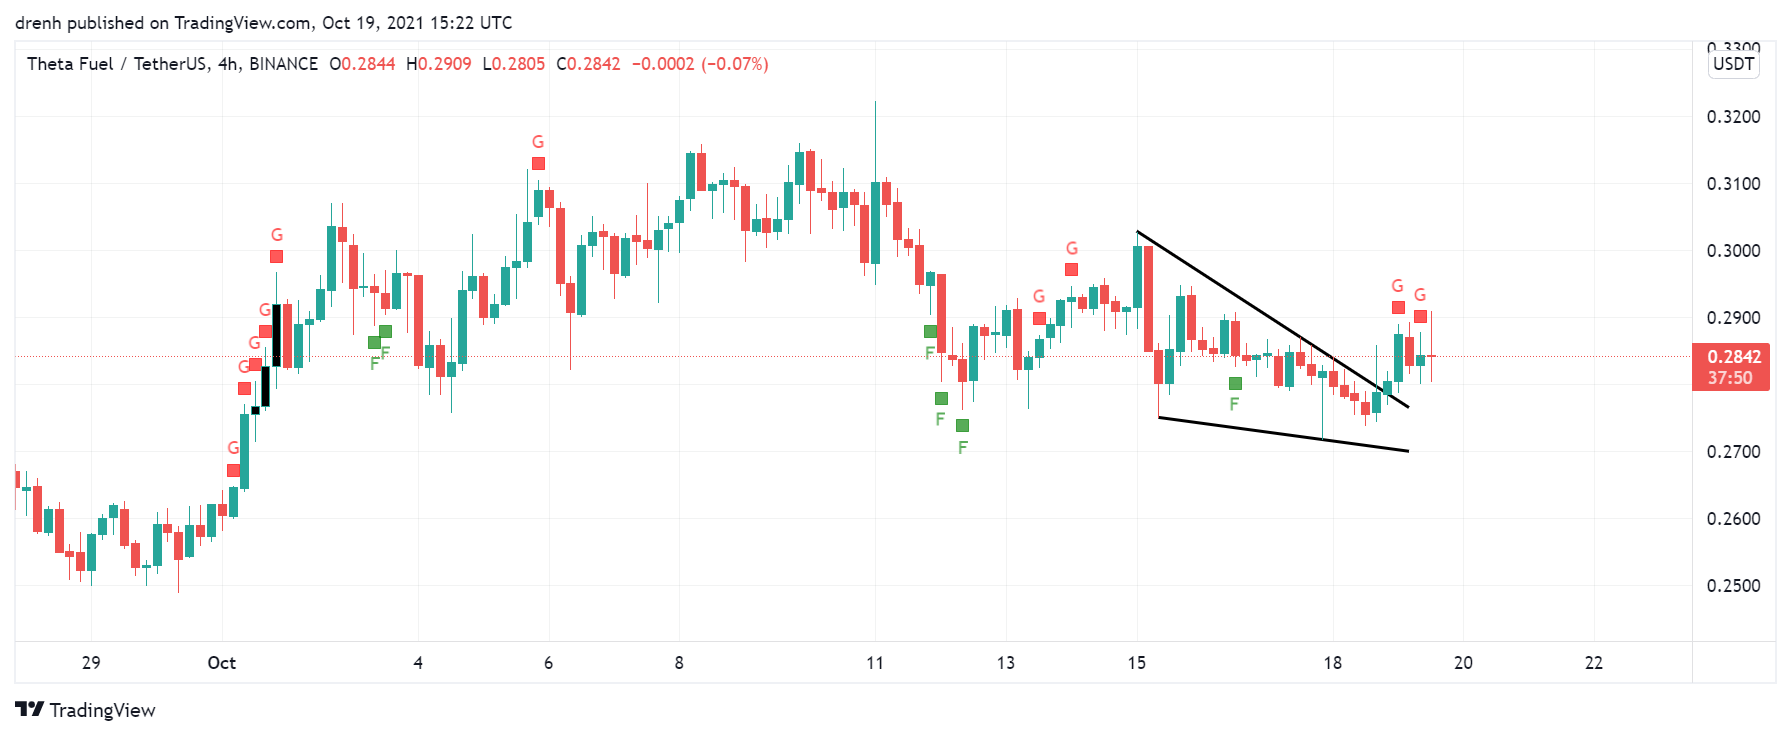
In the last seven days, TFUEL has been bearish after failing to break resistance at $0.32. The price has decreased by 15%, and it is currently attempting to correct upwards. A descending wedge pattern has taken shape, which indicates bearish tendencies. Nonetheless, the price has recently surged upwards.
Daily Analysis
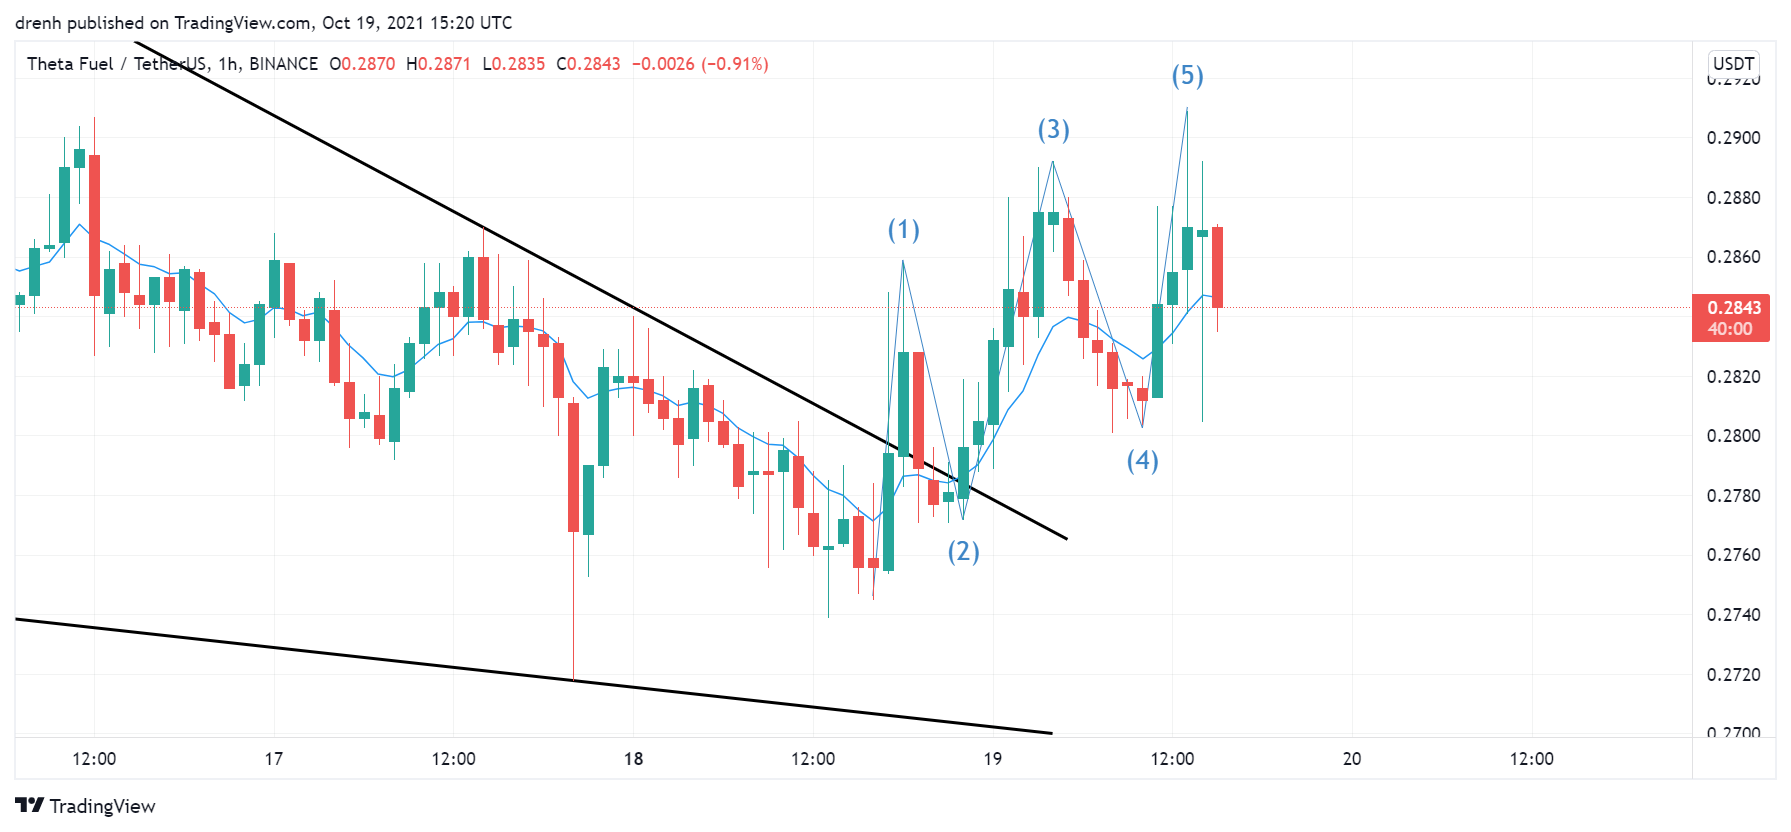
In the intraday chart, TFUEL has been bullish. After breaking the descending wedge channel, TFUEL has moved upwards and formed the Elliot Waves pattern. Since the last wave has finished, we could see corrective waves A, B, and C in the coming hours.

Key Structures
Support
- $0.25
Resistance
- $0.32
Indicators
Moving Average
Due to the recent price decrease, the 20-day moving average has now moved above the price, indicating that the trend is now downward and that the price of TFUEL could keep decreasing in the coming days.
The 9-day EMA has also moved above the price, meaning that the trend is now downward. The EMA line is currently acting as resistance to the price of TFUEL.
Relative Strength Index
The RSI of a daily chart is below 50 and has not shown signs of major movements recently. This indicates that the price has room for growth in the coming days, but the momentum is still bearish. In the 4-hour chart, the RSI is slightly less bearish.
MACD
The MACD line has recently intersected with the signal line in the daily chart. Since the former is now below, the momentum is bearish for TFUEL. As for the 4-hour chart, the MACD line is quite above the signal line due to the recent increase in the intraday chart. It is heading above the baseline, and it indicates that the momentum is bullish in the shorter run.
Fear & Greed
The fear and greed indicator in a 4-hour chart suggests that the current emotion of TFUEL traders is greed due to the recent increase in the price. This means that TFUEL traders are bullish.

Fibonacci
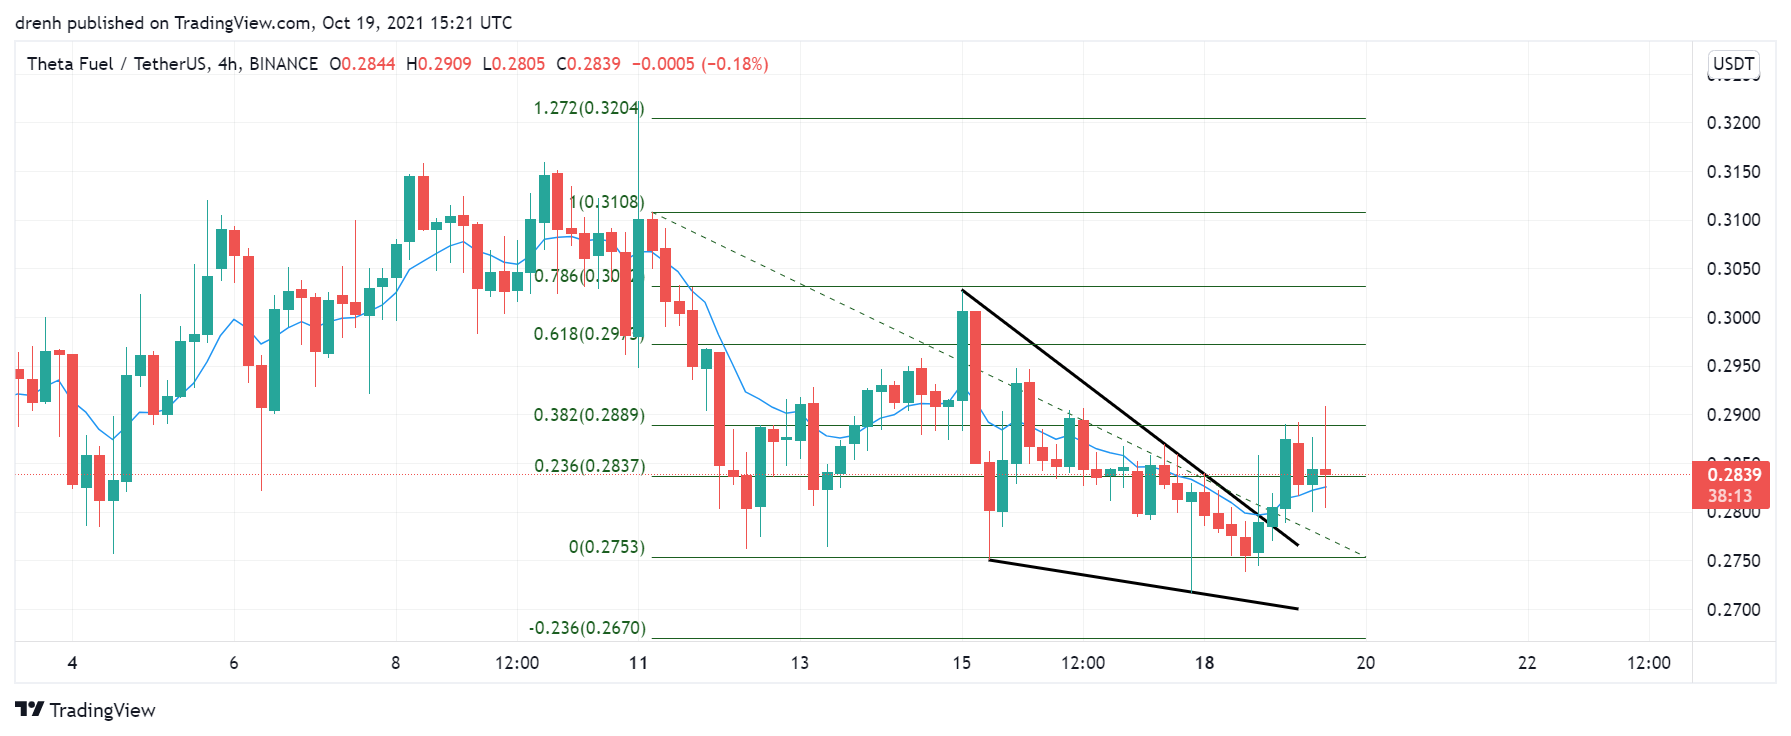
The Fibonacci retracement levels in a 4-hour chart suggest that the price of TFUEL has retraced to the 78.6% retracement level recently. This indicated that the price would keep going down in the coming days.
Price Prediction TFUEL – October 2021
Based on this technical analysis on Theta Fuel (TFUEL), we could see its price decrease in the coming hours, and it may soon retest support at $0.25. Nonetheless, if it finds support, then we could expect TFUEl to increase in the coming days. If BTC keeps its momentum, TFUEL could attempt to reach a new all-time high in the coming weeks since it is largely affected by the former. Eventually, TFUEL has the potential to go as high as $1 in this bullish trend.
Latest News for TFUEL – Affecting Price
Theta Fuel is becoming more popular when it comes to decentralized streaming services. It can capitalize its potential in this bullish since video streaming is one of the most used services of today’s world. Therefore, the price of TFUEL could be largely increased in the coming weeks.
Also read: Theta Fuel (TFUEL) Price Prediction 2021 and Beyond – Is TFUEL a Good Investment?